> ## Documentation Index
> Fetch the complete documentation index at: https://docs.paradime.io/llms.txt
> Use this file to discover all available pages before exploring further.
# Debugging Failed Runs
> Learn how to efficiently debug failed dbt™ runs in Paradime using Bolt.
When running dbt™ in production, it's crucial to quickly identify and resolve failed runs. This guide will walk you through the process of debugging failed dbt™ runs using Bolt's comprehensive logging and debugging tools.
**Estimated completion time:** 15 minutes
**Prerequisites**
* Access to the [Bolt application](https://www.paradime.io/pricing) in Paradime
* At least one configured Bolt schedule
* Basic understanding of dbt™ commands and SQL
**What you'll learn**
In this guide, you'll learn how to:
1. [Identify failed runs](/guides/paradime-101/running-dbt-in-production-with-bolt/debugging-failed-runs#id-1.-identifying-failed-runs)
2. [Access and interpret run logs](/guides/paradime-101/running-dbt-in-production-with-bolt/debugging-failed-runs#id-2.-access-and-interpret-run-logs)
3. [Debug and resolve common issues](/guides/paradime-101/running-dbt-in-production-with-bolt/debugging-failed-runs#id-3.-debug-and-resolve-common-issues)
***
### 1. Identifying Failed Runs
There are two main ways to identify failed runs:
**Method 1: Notifications**
Set up [Slack or email notifications](/guides/paradime-101/running-dbt-in-production-with-bolt/setting-up-notifications) to receive immediate alerts when a run fails. This is the recommended approach for production environments.
See [Setting Up Notifications](/guides/paradime-101/running-dbt-in-production-with-bolt/setting-up-notifications) for details on configuring alerts.
**Method 2: Bolt UI**
Navigate to the [Bolt home screen](https://app.paradime.io/bolt/) and check the "Status" column in the Bolt Schedule List. Failed runs are marked with a "Error" status indicator.
See [Viewing Run History and Analytics](/guides/paradime-101/running-dbt-in-production-with-bolt/viewing-run-history-and-analytics) for more details on using the Bolt UI.
***
### 2. Access and interpret run logs
Once you've identified a failed run, access the logs through the Bolt Schedule Detail Views:
1. Click on the failed Bolt Schedule (one marked with a "Error" status indicator)
2. Navigate to the **Run History** section
3. Select the failed run (one marked with a "Error" status indicator)
4. Scroll to the **Logs and Artifacts** section
5. Click on the executed command that failed (ex. `dbt run`)
Bolt Provides three types of logs:
| Run Log Type | Description | Use Case |
| ---------------- | ----------------------------------------------------------------------------------------------------------------------------------------------------------------- | ---------------------------------------- |
| **Summary Logs** | [DinoAI-generated](/guides/paradime-101/getting-started-with-the-paradime-ide/dinoai-accelerating-your-analytics-engineering-workflow/index) overview of failures | Quick assessment of issues |
| **Console Logs** | Detailed execution record | Finding specific errors and compiled SQL |
| **Debug Logs** | System-level operations | Deep technical troubleshooting |
**Console logs** are typically the most useful for debugging as they show errors, warnings, and the compiled SQL code that failed in production.
***
### 3. Debug and resolve common issues
Follow these steps to debug a failed run:
1. **Review Summary Logs**
* Check the AI-generated overview
* Note any suggested fixes
```title="Summary Logs Example" theme={"system"}
Command executed 6 models:
- 5 models passed
- 1 model failed
- Error in "fct_fantasy_point_leaders" model
- Invalid identifier 'TOTAL_FANTASY_POINTS_PP' on line 9
```
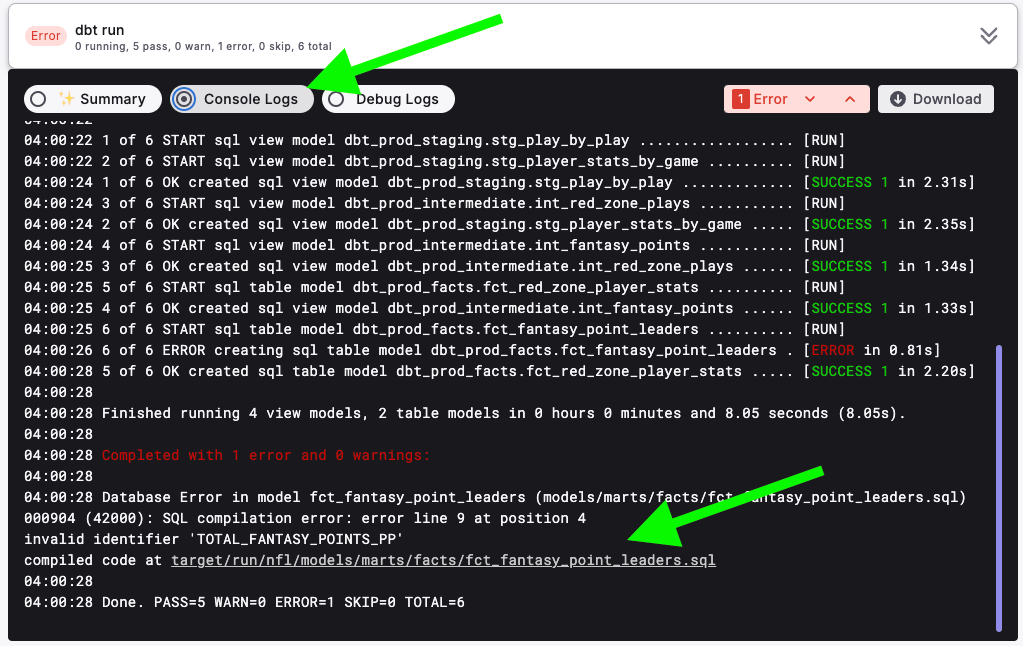
2. **Review Console Logs**
* Locate error messages and warnings using the "jump to" feature
* Click on the link for compiled SQL code
* Review the execution flow and timing
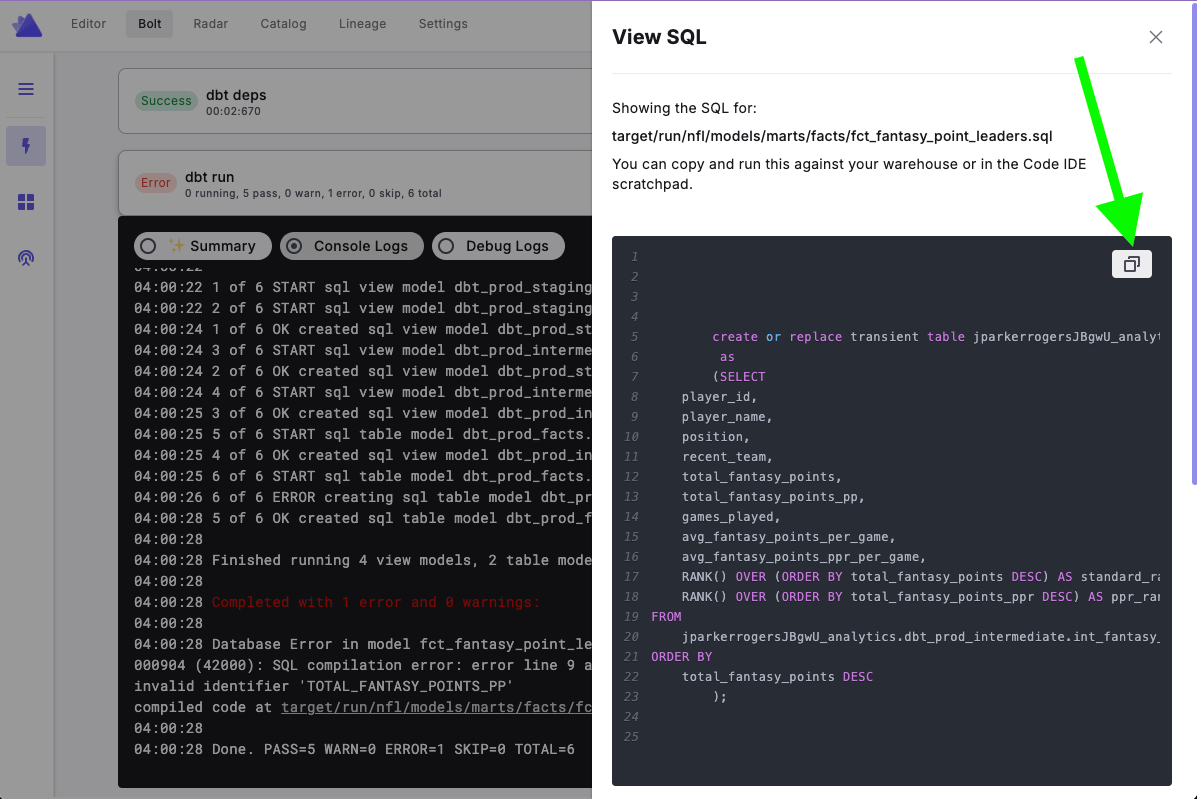
3. **Test and Fix**
* Copy the compiled SQL code from console logs
* Test the SQL:
* Directly in your data warehouse, or
* In the Code IDE [scratchpad](/products/code-ide/additional-features/scratchpad)
* Fix common issues:
* Invalid column names
* Missing model references
* SQL syntax errors
* Data type mismatches
After testing the compiled SQL code against your data warehouse, you'll be better equipped to resolve common issues with failed scheduled runs.
***
**Related Documentation**
* [Setting Up Notifications](/products/bolt/creating-schedules/notification-settings)
* [Viewing Run History and Analytics](/products/bolt/managing-schedules/viewing-run-log-history)
***
#### Summary
You've learned how to identify failed dbt™ runs, access and interpret different types of logs, and systematically debug and resolve issues. This knowledge will help you maintain reliable data pipelines and quickly resolve any failures that occur.
Next, consider exploring the related documentation to handle more complex failure scenarios.
## Related topics
- [Managing dbt™ Schedules with Bolt](/guides/paradime-101/running-dbt-in-production-with-bolt/index.md)
- [Debugging Failed dbt™ Commands with Terminal Context](/products/dino-ai/copilot/use-cases/debugging-failed-dbt-tm-commands-with-terminal-context.md)
- [Retrying a Failed Run](/products/bolt/managing-schedules/retrying-a-failed-run.md)
- [Bolt CLI](/developers/paradime-cli/bolt-cli.md)
- [Bolt API](/developers/graphql-api/api-reference/bolt-api.md)
 3. **Test and Fix**
* Copy the compiled SQL code from console logs
* Test the SQL:
* Directly in your data warehouse, or
* In the Code IDE [scratchpad](/products/code-ide/additional-features/scratchpad)
* Fix common issues:
* Invalid column names
* Missing model references
* SQL syntax errors
* Data type mismatches
3. **Test and Fix**
* Copy the compiled SQL code from console logs
* Test the SQL:
* Directly in your data warehouse, or
* In the Code IDE [scratchpad](/products/code-ide/additional-features/scratchpad)
* Fix common issues:
* Invalid column names
* Missing model references
* SQL syntax errors
* Data type mismatches
 After testing the compiled SQL code against your data warehouse, you'll be better equipped to resolve common issues with failed scheduled runs.
***
After testing the compiled SQL code against your data warehouse, you'll be better equipped to resolve common issues with failed scheduled runs.
***