> ## Documentation Index
> Fetch the complete documentation index at: https://docs.paradime.io/llms.txt
> Use this file to discover all available pages before exploring further.
# Anomaly Detection Tests
> Elementary Data - Anomaly Detection: Implement anomaly detection tests for dbt™ projects in Paradime. Ensure data accuracy and reliability.
### Overview
Elementary data anomaly detection tests monitor specific metrics (like row count, null rate, average value, etc.) and compare recent values to historical data. This process helps detect [significant changes and deviations](https://docs.elementary-data.com/data-tests/data-anomaly-detection), that are probably data reliability issues.
### How Anomaly Detection Works
#### Test Execution Process
1. Data is split into time buckets based on the `time_bucket` field.
2. The data is limited by the `training_period` variable.
3. The test compares a specific metric (e.g., row count) of the buckets within the `detection_period` to all previous time buckets within the `training_period`.
4. If anomalies are detected in the detection period, the test fails.
5. The elementary package executes relevant monitors and searches for anomalies by comparing to historical metrics.
#### When a Test Fails
A test failure indicates that an anomaly was detected for the specific metric and dataset. For more details, refer to the [anomaly detection method](/integrations/elementary-data/anomaly-detection-tests/index#data-anomaly-detection-method).
### Core concepts
A value in the detection set that is an outlier compared to the expected range calculated based on the training set.
The complete dataset used for the data monitor, including both training set and detection set values.
Different metrics (freshness, volume, nullness, uniqueness, distribution, etc.) that we monitor to detect problems.
The set of values used as a reference point to calculate the expected range.
The set of values compared to the expected range. Outliers in this set are flagged as anomalies.
The range of values considered normal, calculated based on the training set.
The time period from which the training set is collected. This is typically a recent period, as data patterns may change over time.
The period containing values that are compared to the expected range.
The consistent time intervals into which data is split for analysis. For example, daily buckets for monitoring row count anomalies.
### Data anomaly detection method
Elementary uses the "[standard score](https://en.wikipedia.org/wiki/Standard_score)" (Z-score) for anomaly detection. This score represents the number of standard deviations a value is from the mean of a set of values.
#### [Empirical rule](https://www.statisticshowto.com/probability-and-statistics/statistics-definitions/empirical-rule-2/) in Normal Distribution
* **\~68%** of values have an absolute **z-score of 1 or less.**
* **\~95%** of values have an absolute **z-score of 2 or less.**
* **\~99.7%** of values have an absolute **z-score of 3 or less.**
Values with a **standard score of 3 and above are** [**considered outliers**](https://www.ctspedia.org/do/view/CTSpedia/OutLier)**.** This is Elementary's default threshold, which can be adjusted using the `anomaly_score_threshold` variable in the [global configuration](https://docs.elementary-data.com/data-tests/elementary-tests-configuration).
#### Adjusting Sensitivity
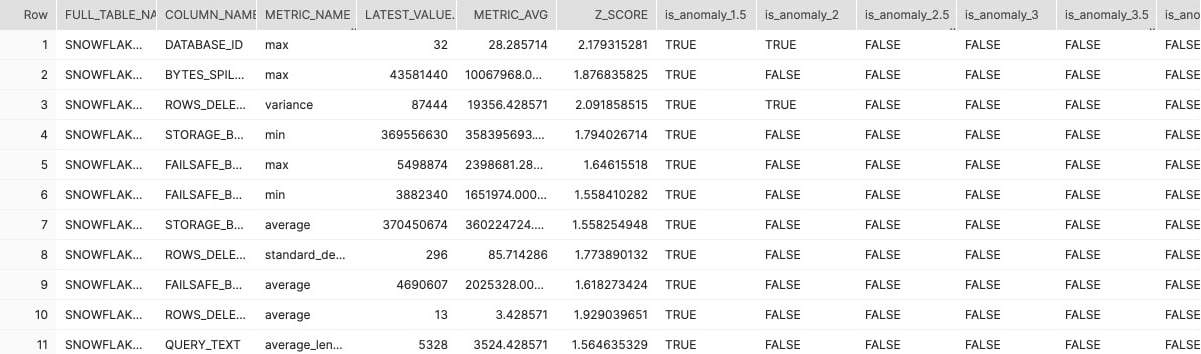
Within your [Elementary Schema](/integrations/elementary-data/index#id-4.-build-elementary-models) in your data warehouse, access the `anomaly_sensitivity` model to see how different scores would affect anomaly detection based on your last run's metric values. This can help in deciding whether to adjust the sensitivity.
 **Best Practices**
* Regularly review and adjust your anomaly detection settings based on your data patterns.
* Consider seasonality and known data fluctuations when interpreting results.
* Use anomaly detection in conjunction with other data quality tests for comprehensive monitoring.
## Related topics
- [Anomaly Detection Tests](/integrations/elementary-data/anomaly-detection-tests/index.md)
- [Anomaly Tests Parameters](/integrations/elementary-data/anomaly-detection-tests/anomaly-tests-parameters.md)
- [Volume Anomalies](/integrations/elementary-data/anomaly-detection-tests/volume-anomalies.md)
- [Freshness Anomalies](/integrations/elementary-data/anomaly-detection-tests/freshness-anomalies.md)
- [Column Anomalies](/integrations/elementary-data/anomaly-detection-tests/column-anomalies.md)
**Best Practices**
* Regularly review and adjust your anomaly detection settings based on your data patterns.
* Consider seasonality and known data fluctuations when interpreting results.
* Use anomaly detection in conjunction with other data quality tests for comprehensive monitoring.
## Related topics
- [Anomaly Detection Tests](/integrations/elementary-data/anomaly-detection-tests/index.md)
- [Anomaly Tests Parameters](/integrations/elementary-data/anomaly-detection-tests/anomaly-tests-parameters.md)
- [Volume Anomalies](/integrations/elementary-data/anomaly-detection-tests/volume-anomalies.md)
- [Freshness Anomalies](/integrations/elementary-data/anomaly-detection-tests/freshness-anomalies.md)
- [Column Anomalies](/integrations/elementary-data/anomaly-detection-tests/column-anomalies.md)