> ## Documentation Index
> Fetch the complete documentation index at: https://docs.paradime.io/llms.txt
> Use this file to discover all available pages before exploring further.
# Quadrant Chart
### What are Quadrant Charts?
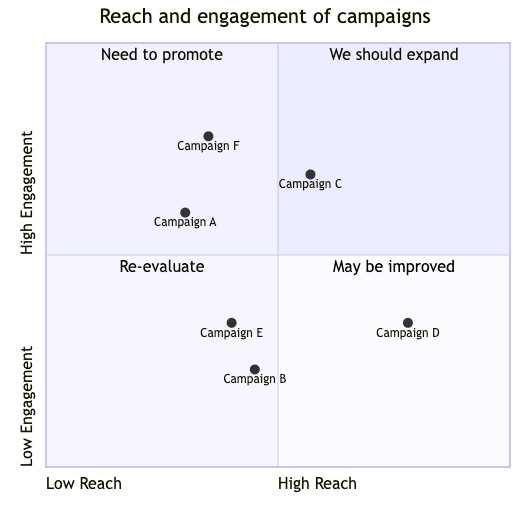
Mermaid's Quadrant charts are a visual tool used to plot data points across two dimensions, divided into four quadrants. They help in analyzing data patterns and trends, and are widely used in business, marketing, and strategic decision-making. Each quadrant represents a distinct area of analysis, often defined by specific criteria relevant to the dataset.
### Creating Your First Quadrant Chart
1. **Launch DinoAI:** From Code IDE, access [DinoAI](/products/dino-ai/index) to start creating diagrams.
2. **Use a Simple Prompt:** Tell DinoAI what kind of Quadrant Chart you want to create. For example:
```text theme={"system"}
- "Create a mermaid quadrant chart analyzing data project priority vs. effort for my roadmap"
- "Generate a mermaid quadrant chart for data quality assessment with accuracy vs. completeness"
- "Build a mermaid quadrant chart showing data source evaluation with reliability vs. business value"
```
3. **Get Your Diagram:** DinoAI will generate a complete `.mmd` file with proper Mermaid syntax.
4. **Preview Your Work:** Click the eye icon (👁️) to preview your diagram in real-time as you edit.
5. **Iterate and Refine:** Modify the generated `.mmd` file directly, or ask DinoAI to make specific changes.
#### Example:
```mermaid theme={"system"}
quadrantChart
title Reach and engagement of campaigns
x-axis Low Reach --> High Reach
y-axis Low Engagement --> High Engagement
quadrant-1 We should expand
quadrant-2 Need to promote
quadrant-3 Re-evaluate
quadrant-4 May be improved
Campaign A: [0.3, 0.6]
Campaign B: [0.45, 0.23]
Campaign C: [0.57, 0.69]
Campaign D: [0.78, 0.34]
Campaign E: [0.40, 0.34]
Campaign F: [0.35, 0.78]
```
 **Reusable Quadrant Chart prompts for you and your team**
You can create custom, standardized [.dinoprompts](/products/dino-ai/copilot/dino-prompts) for Mermaid's Quadrant Charts that ensure consistency across your data team. See [step-by-step guide.](/integrations/mermaid-js/index#creating-mermaid-diagrams-with-.dinoprompts)
***
### Diagram Syntax Guide
#### Basic Syntax
* **Title**: Describes the chart and appears at the top.
```mermaid theme={"system"}
quadrantChart
title Campaign Analysis
```
* **Axes**: Label the x-axis and y-axis using descriptive text.
```mermaid theme={"system"}
x-axis Low Reach --> High Reach
y-axis Low Engagement --> High Engagement
```
* **Quadrants**: Assign text to each quadrant for categorization.
```mermaid theme={"system"}
quadrant-1 Expand
quadrant-2 Promote
quadrant-3 Reassess
quadrant-4 Improve
```
* **Points**: Plot data points with values between 0 and 1 for both x and y.
```mermaid theme={"system"}
Campaign A: [0.3, 0.6]
Campaign B: [0.5, 0.4]
```
#### Customizations
* Add color, size, and styling to points:
```mermaid theme={"system"}
Campaign A: [0.9, 0.0] radius: 12
Campaign B: [0.8, 0.1] color: #ff3300
```
* Use classes for consistent styling:
```mermaid theme={"system"}
Campaign A:::class1: [0.9, 0.0]
classDef class1 color: #109060
```
### Data Team Examples
#### Marketing Campaign Analysis
```mermaid theme={"system"}
quadrantChart
title Campaign Performance
x-axis Low Reach --> High Reach
y-axis Low Engagement --> High Engagement
quadrant-1 Expand
quadrant-2 Promote
quadrant-3 Reassess
quadrant-4 Improve
Campaign A: [0.2, 0.8]
Campaign B: [0.5, 0.5]
Campaign C: [0.8, 0.3]
```
#### Task Prioritization
```mermaid theme={"system"}
quadrantChart
title Task Urgency and Importance
x-axis Urgent --> Not Urgent
y-axis Not Important --> Important
quadrant-1 Act Immediately
quadrant-2 Plan
quadrant-3 Delegate
quadrant-4 Eliminate
Task A: [0.8, 0.9]
Task B: [0.3, 0.4]
Task C: [0.5, 0.2]
```
### Best Practices
1. Use descriptive labels for quadrants and axes.
2. Plot only relevant data points to maintain clarity.
3. Add color coding or size variation for additional dimensions.
4. Keep quadrants evenly spaced and clearly labeled.
5. Adjust chart dimensions and styling as needed for readability.
***
**Additional Resources**
For more syntax options and advanced features, visit the [official Mermaid documentation](https://mermaid.js.org/syntax/quadrantChart.html).
## Related topics
- [Mermaid](/integrations/mermaid-js/index.md)
- [XY Chart](/integrations/mermaid-js/xy-chart.md)
- [Pie Chart](/integrations/mermaid-js/pie-chart-diagrams.md)
- [Snowflake Cost Monitoring](/products/radar/cost-management/snowflake-cost-monitoring.md)
- [Custom Integration](/developers/python-sdk/modules/custom-integration.md)
**Reusable Quadrant Chart prompts for you and your team**
You can create custom, standardized [.dinoprompts](/products/dino-ai/copilot/dino-prompts) for Mermaid's Quadrant Charts that ensure consistency across your data team. See [step-by-step guide.](/integrations/mermaid-js/index#creating-mermaid-diagrams-with-.dinoprompts)
***
### Diagram Syntax Guide
#### Basic Syntax
* **Title**: Describes the chart and appears at the top.
```mermaid theme={"system"}
quadrantChart
title Campaign Analysis
```
* **Axes**: Label the x-axis and y-axis using descriptive text.
```mermaid theme={"system"}
x-axis Low Reach --> High Reach
y-axis Low Engagement --> High Engagement
```
* **Quadrants**: Assign text to each quadrant for categorization.
```mermaid theme={"system"}
quadrant-1 Expand
quadrant-2 Promote
quadrant-3 Reassess
quadrant-4 Improve
```
* **Points**: Plot data points with values between 0 and 1 for both x and y.
```mermaid theme={"system"}
Campaign A: [0.3, 0.6]
Campaign B: [0.5, 0.4]
```
#### Customizations
* Add color, size, and styling to points:
```mermaid theme={"system"}
Campaign A: [0.9, 0.0] radius: 12
Campaign B: [0.8, 0.1] color: #ff3300
```
* Use classes for consistent styling:
```mermaid theme={"system"}
Campaign A:::class1: [0.9, 0.0]
classDef class1 color: #109060
```
### Data Team Examples
#### Marketing Campaign Analysis
```mermaid theme={"system"}
quadrantChart
title Campaign Performance
x-axis Low Reach --> High Reach
y-axis Low Engagement --> High Engagement
quadrant-1 Expand
quadrant-2 Promote
quadrant-3 Reassess
quadrant-4 Improve
Campaign A: [0.2, 0.8]
Campaign B: [0.5, 0.5]
Campaign C: [0.8, 0.3]
```
#### Task Prioritization
```mermaid theme={"system"}
quadrantChart
title Task Urgency and Importance
x-axis Urgent --> Not Urgent
y-axis Not Important --> Important
quadrant-1 Act Immediately
quadrant-2 Plan
quadrant-3 Delegate
quadrant-4 Eliminate
Task A: [0.8, 0.9]
Task B: [0.3, 0.4]
Task C: [0.5, 0.2]
```
### Best Practices
1. Use descriptive labels for quadrants and axes.
2. Plot only relevant data points to maintain clarity.
3. Add color coding or size variation for additional dimensions.
4. Keep quadrants evenly spaced and clearly labeled.
5. Adjust chart dimensions and styling as needed for readability.
***
**Additional Resources**
For more syntax options and advanced features, visit the [official Mermaid documentation](https://mermaid.js.org/syntax/quadrantChart.html).
## Related topics
- [Mermaid](/integrations/mermaid-js/index.md)
- [XY Chart](/integrations/mermaid-js/xy-chart.md)
- [Pie Chart](/integrations/mermaid-js/pie-chart-diagrams.md)
- [Snowflake Cost Monitoring](/products/radar/cost-management/snowflake-cost-monitoring.md)
- [Custom Integration](/developers/python-sdk/modules/custom-integration.md)