Access these details by selecting a Run ID from the Run History table.
Run Details Overview
Analyze your run execution through different visualization tools:DAGs View
Visualize the execution flow of scheduled commands through a directed acyclic graph (DAG), showing:- Command dependencies - Understand which models must complete before others can start
- Execution order - Track the sequence of operations to optimize pipeline flow
- Process relationships - Identify critical paths and potential parallelization opportunities
Model Timeline
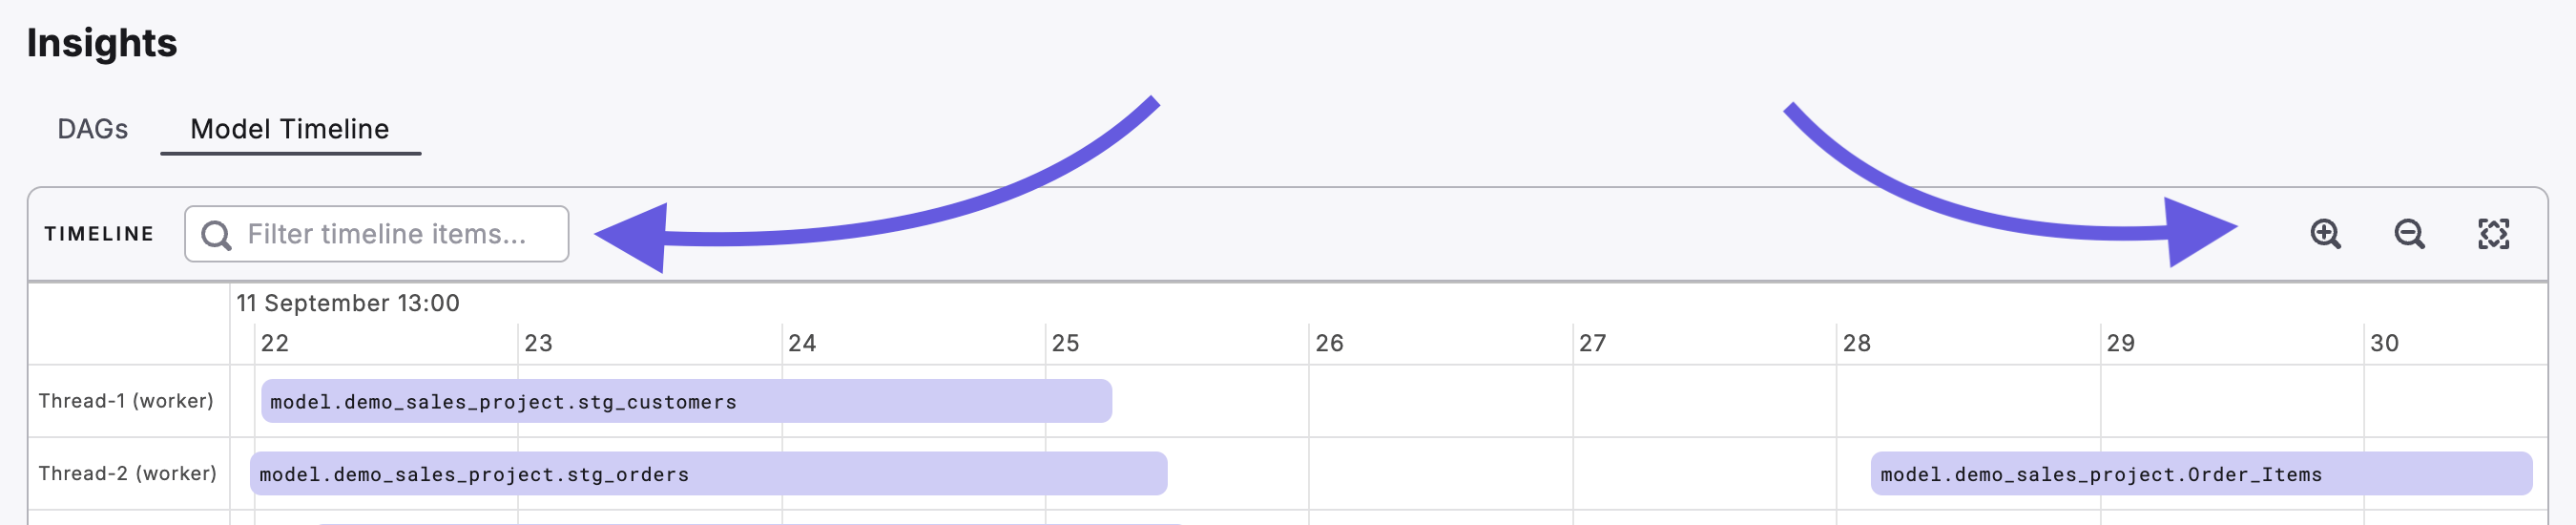
Track the temporal sequence of model execution within your run:- Individual model execution times - Spot which models are taking longer than expected
- Parallel processing visualization - See which models run simultaneously to maximize efficiency
- Performance bottleneck identification - Find slow-running models that delay your entire pipeline
Enhanced Navigation: The model timeline includes search and filter functionality to quickly locate specific models by name, plus zoom controls to focus on specific time periods or view the entire run at once.
Logs and Artifacts
Explore additional metadata for each run ID, including a breakdown of run logs, source freshness, and artifacts.Run Logs
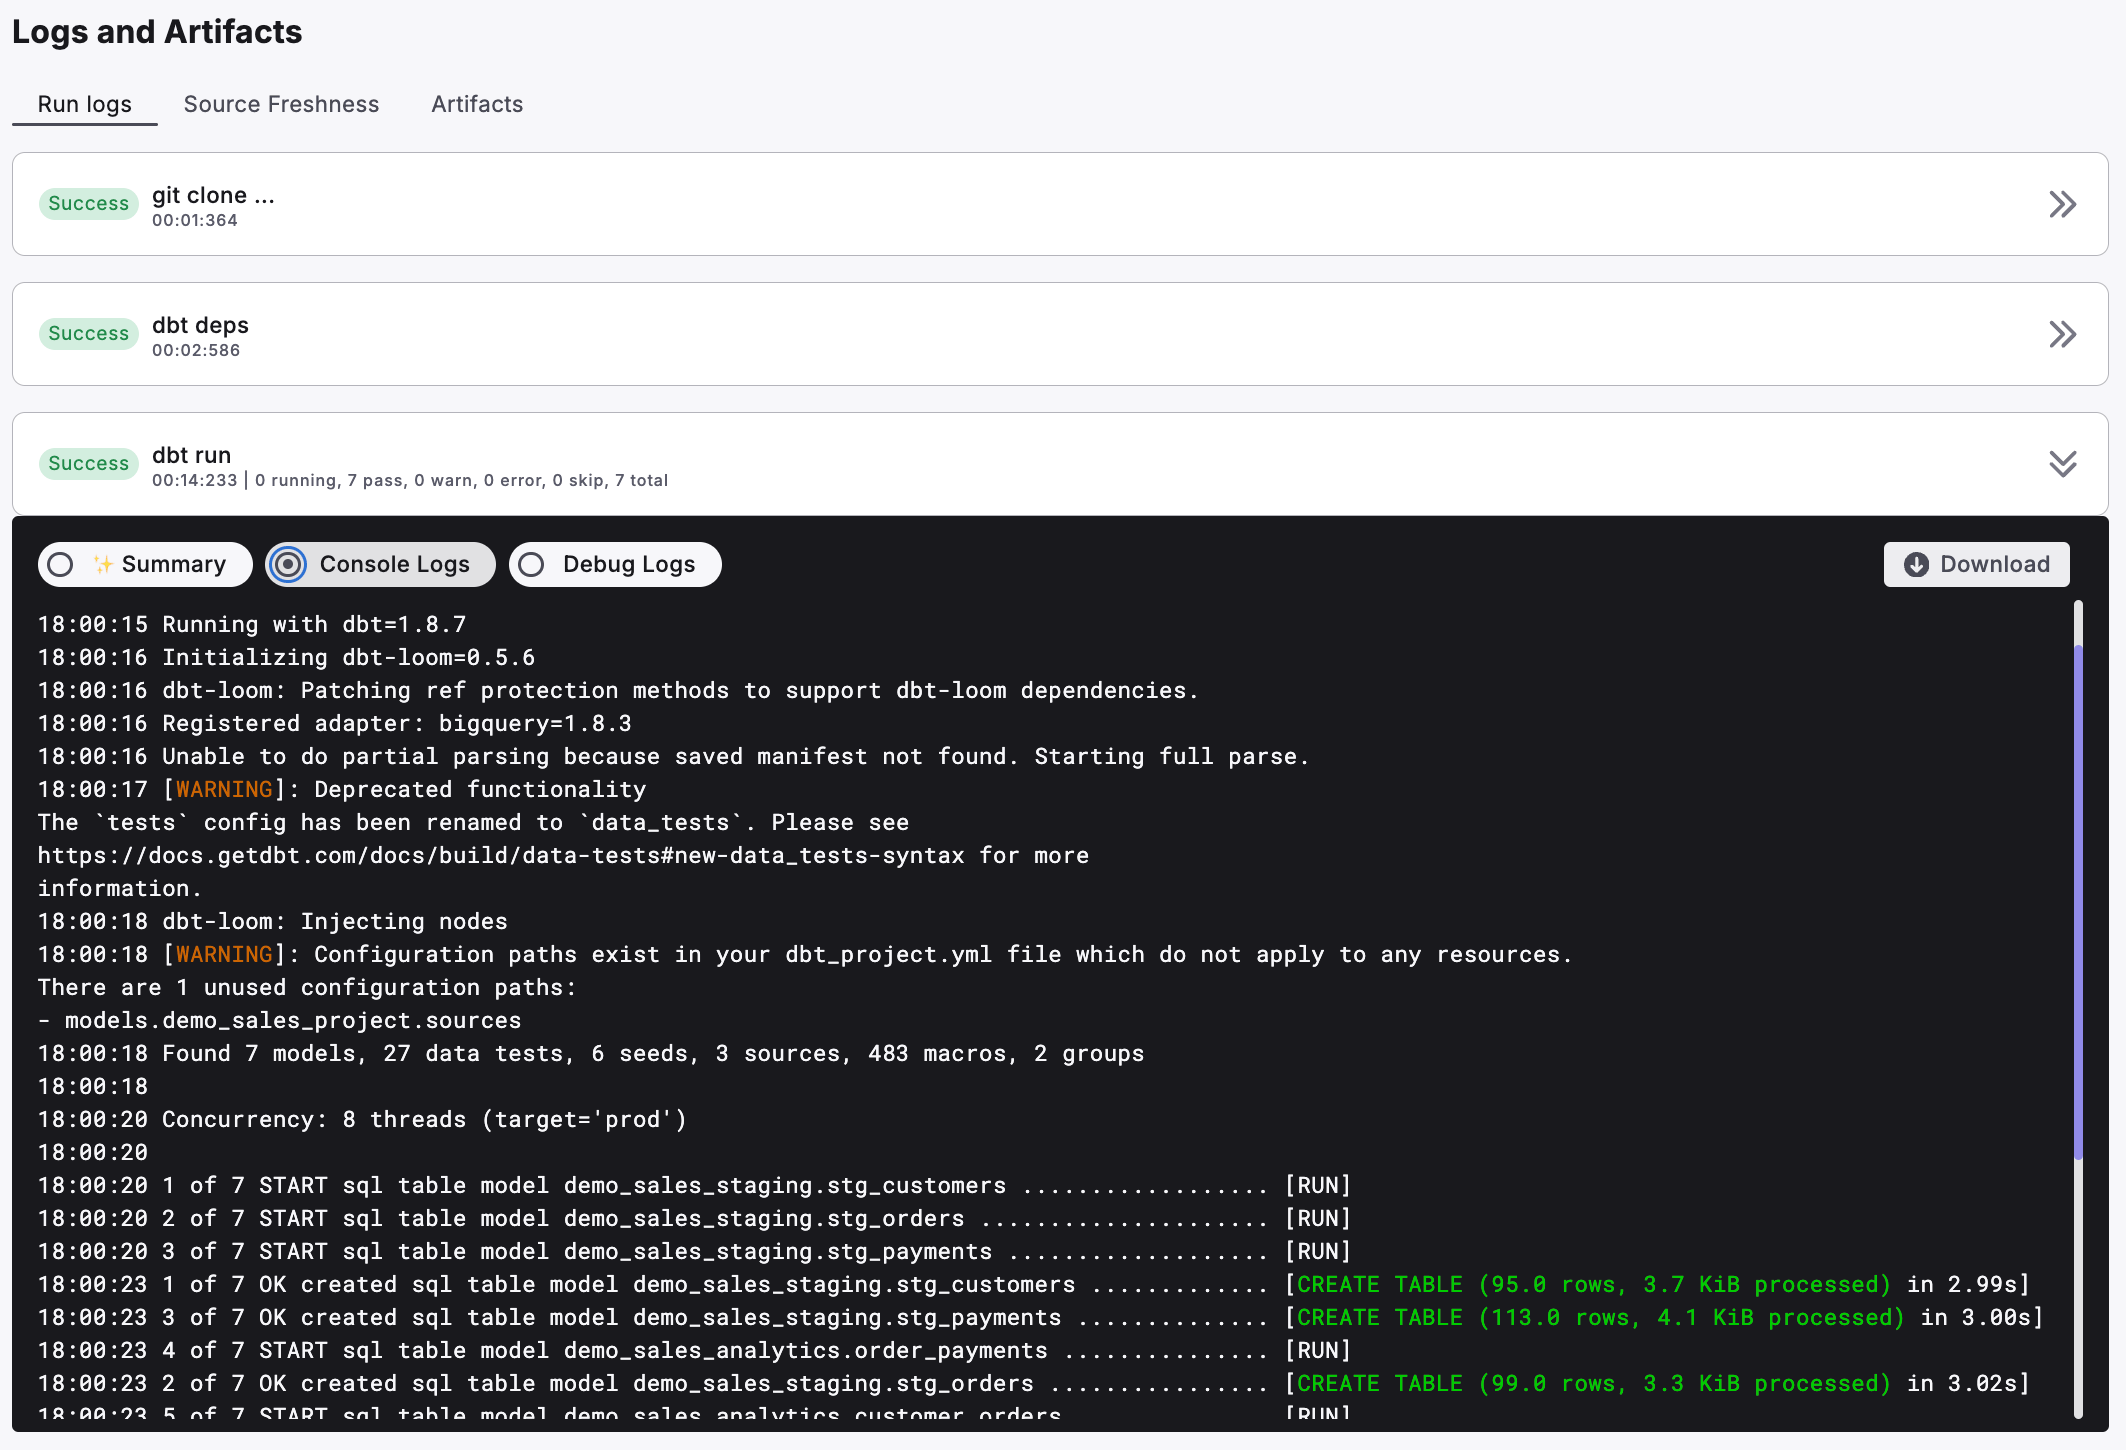
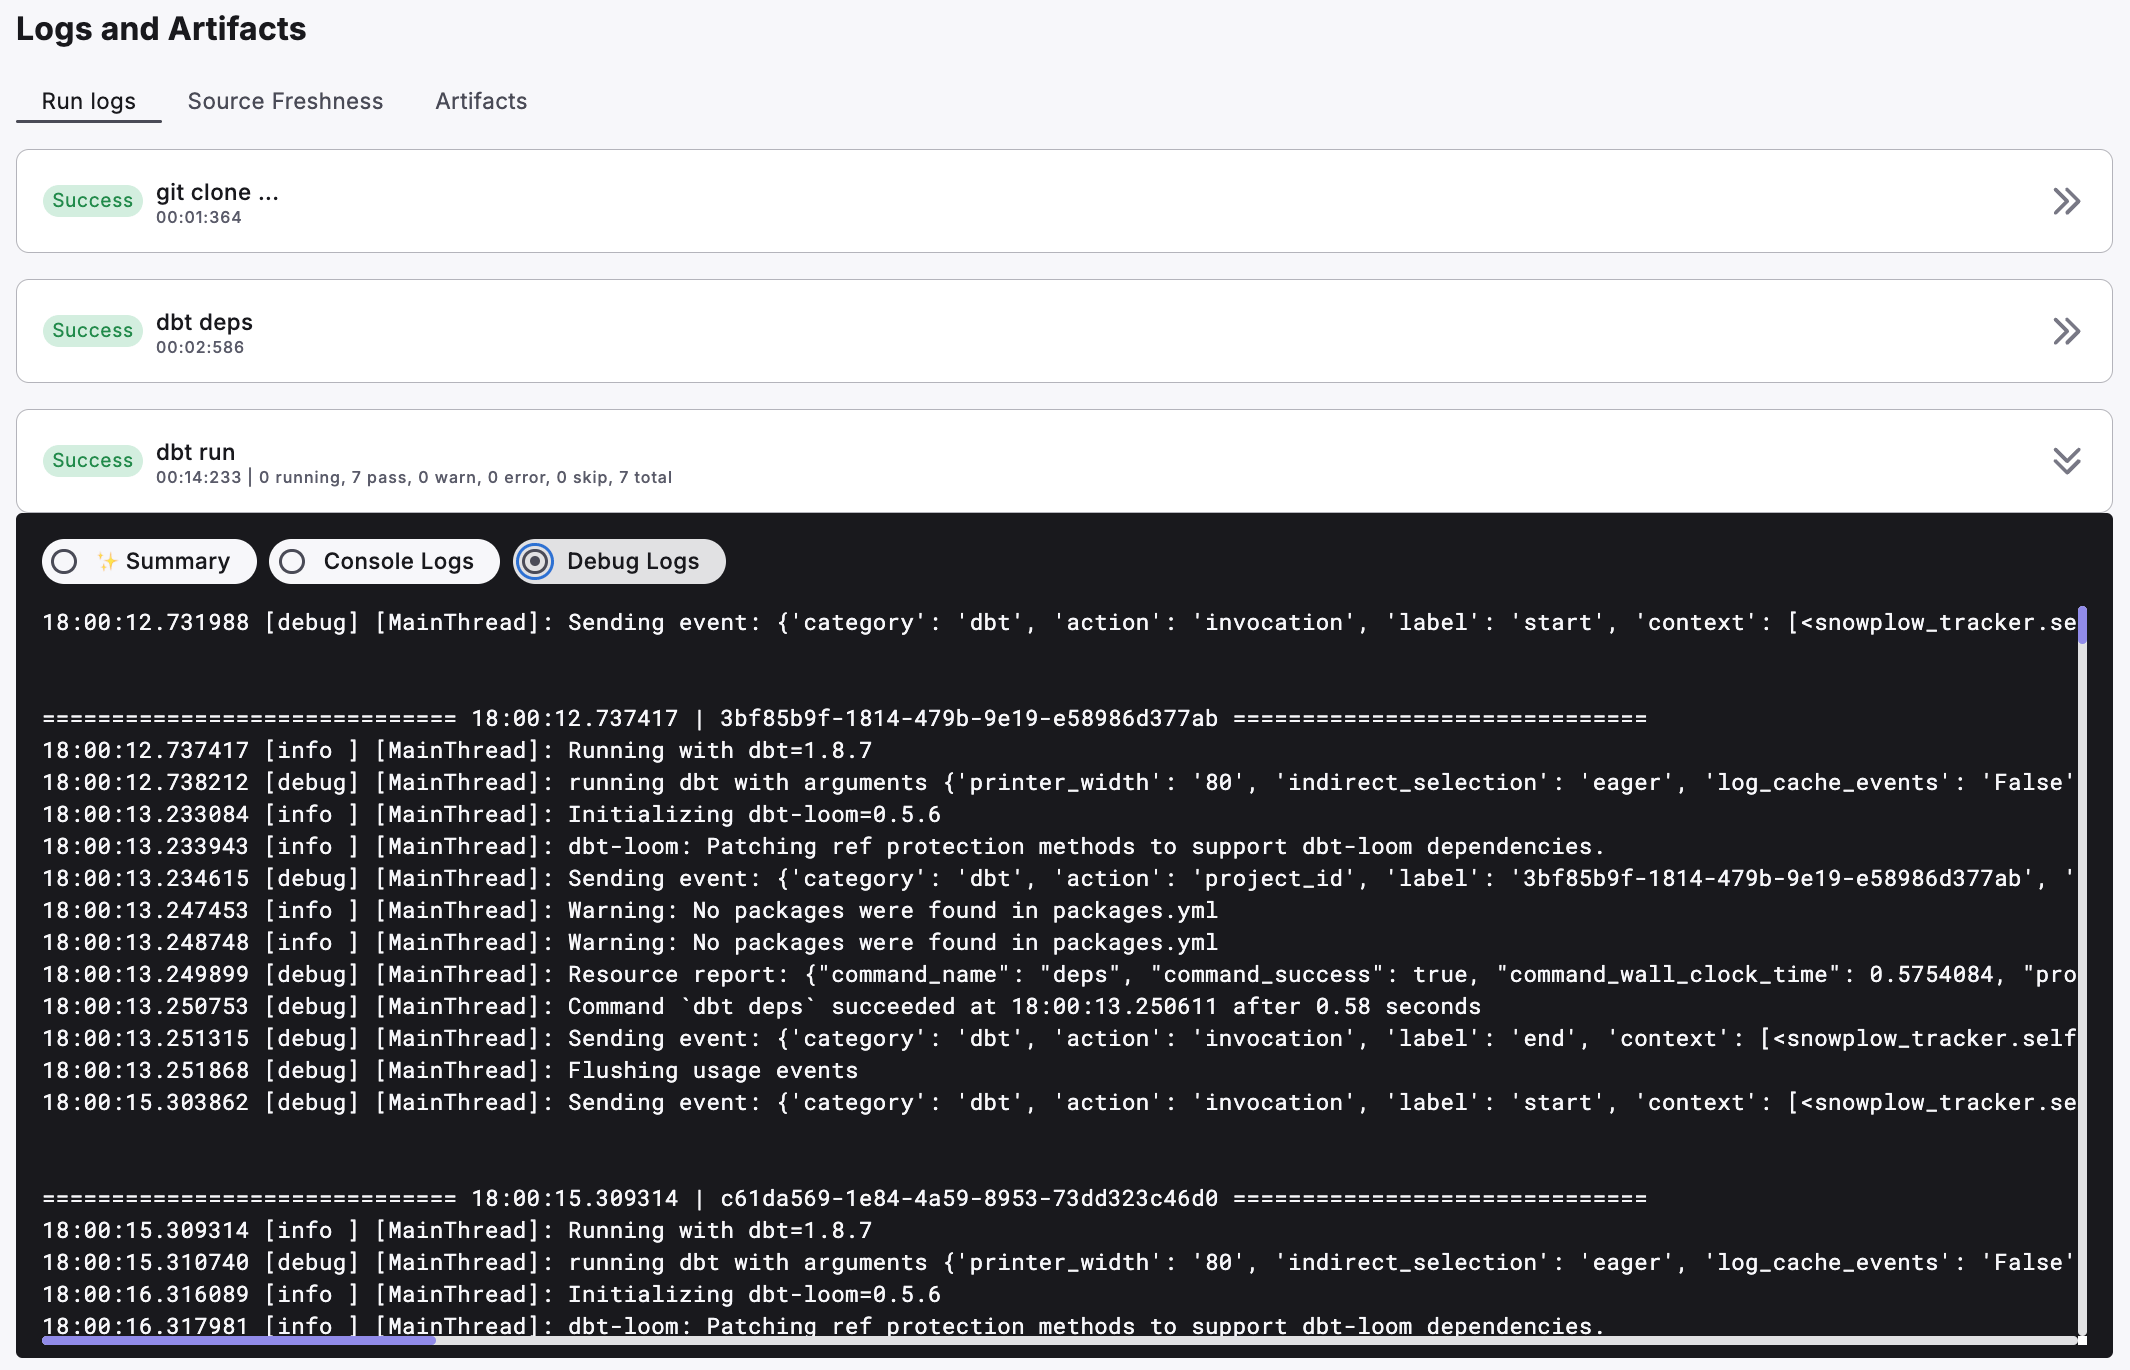
The Run Logs section provides a detailed breakdown of each scheduled run, offering insights into execution status, performance, and any encountered issues. This section is divided into three tabs: Summary, Console Logs, and Debug Logs.- Summary
- Console Logs
- Debug Logs
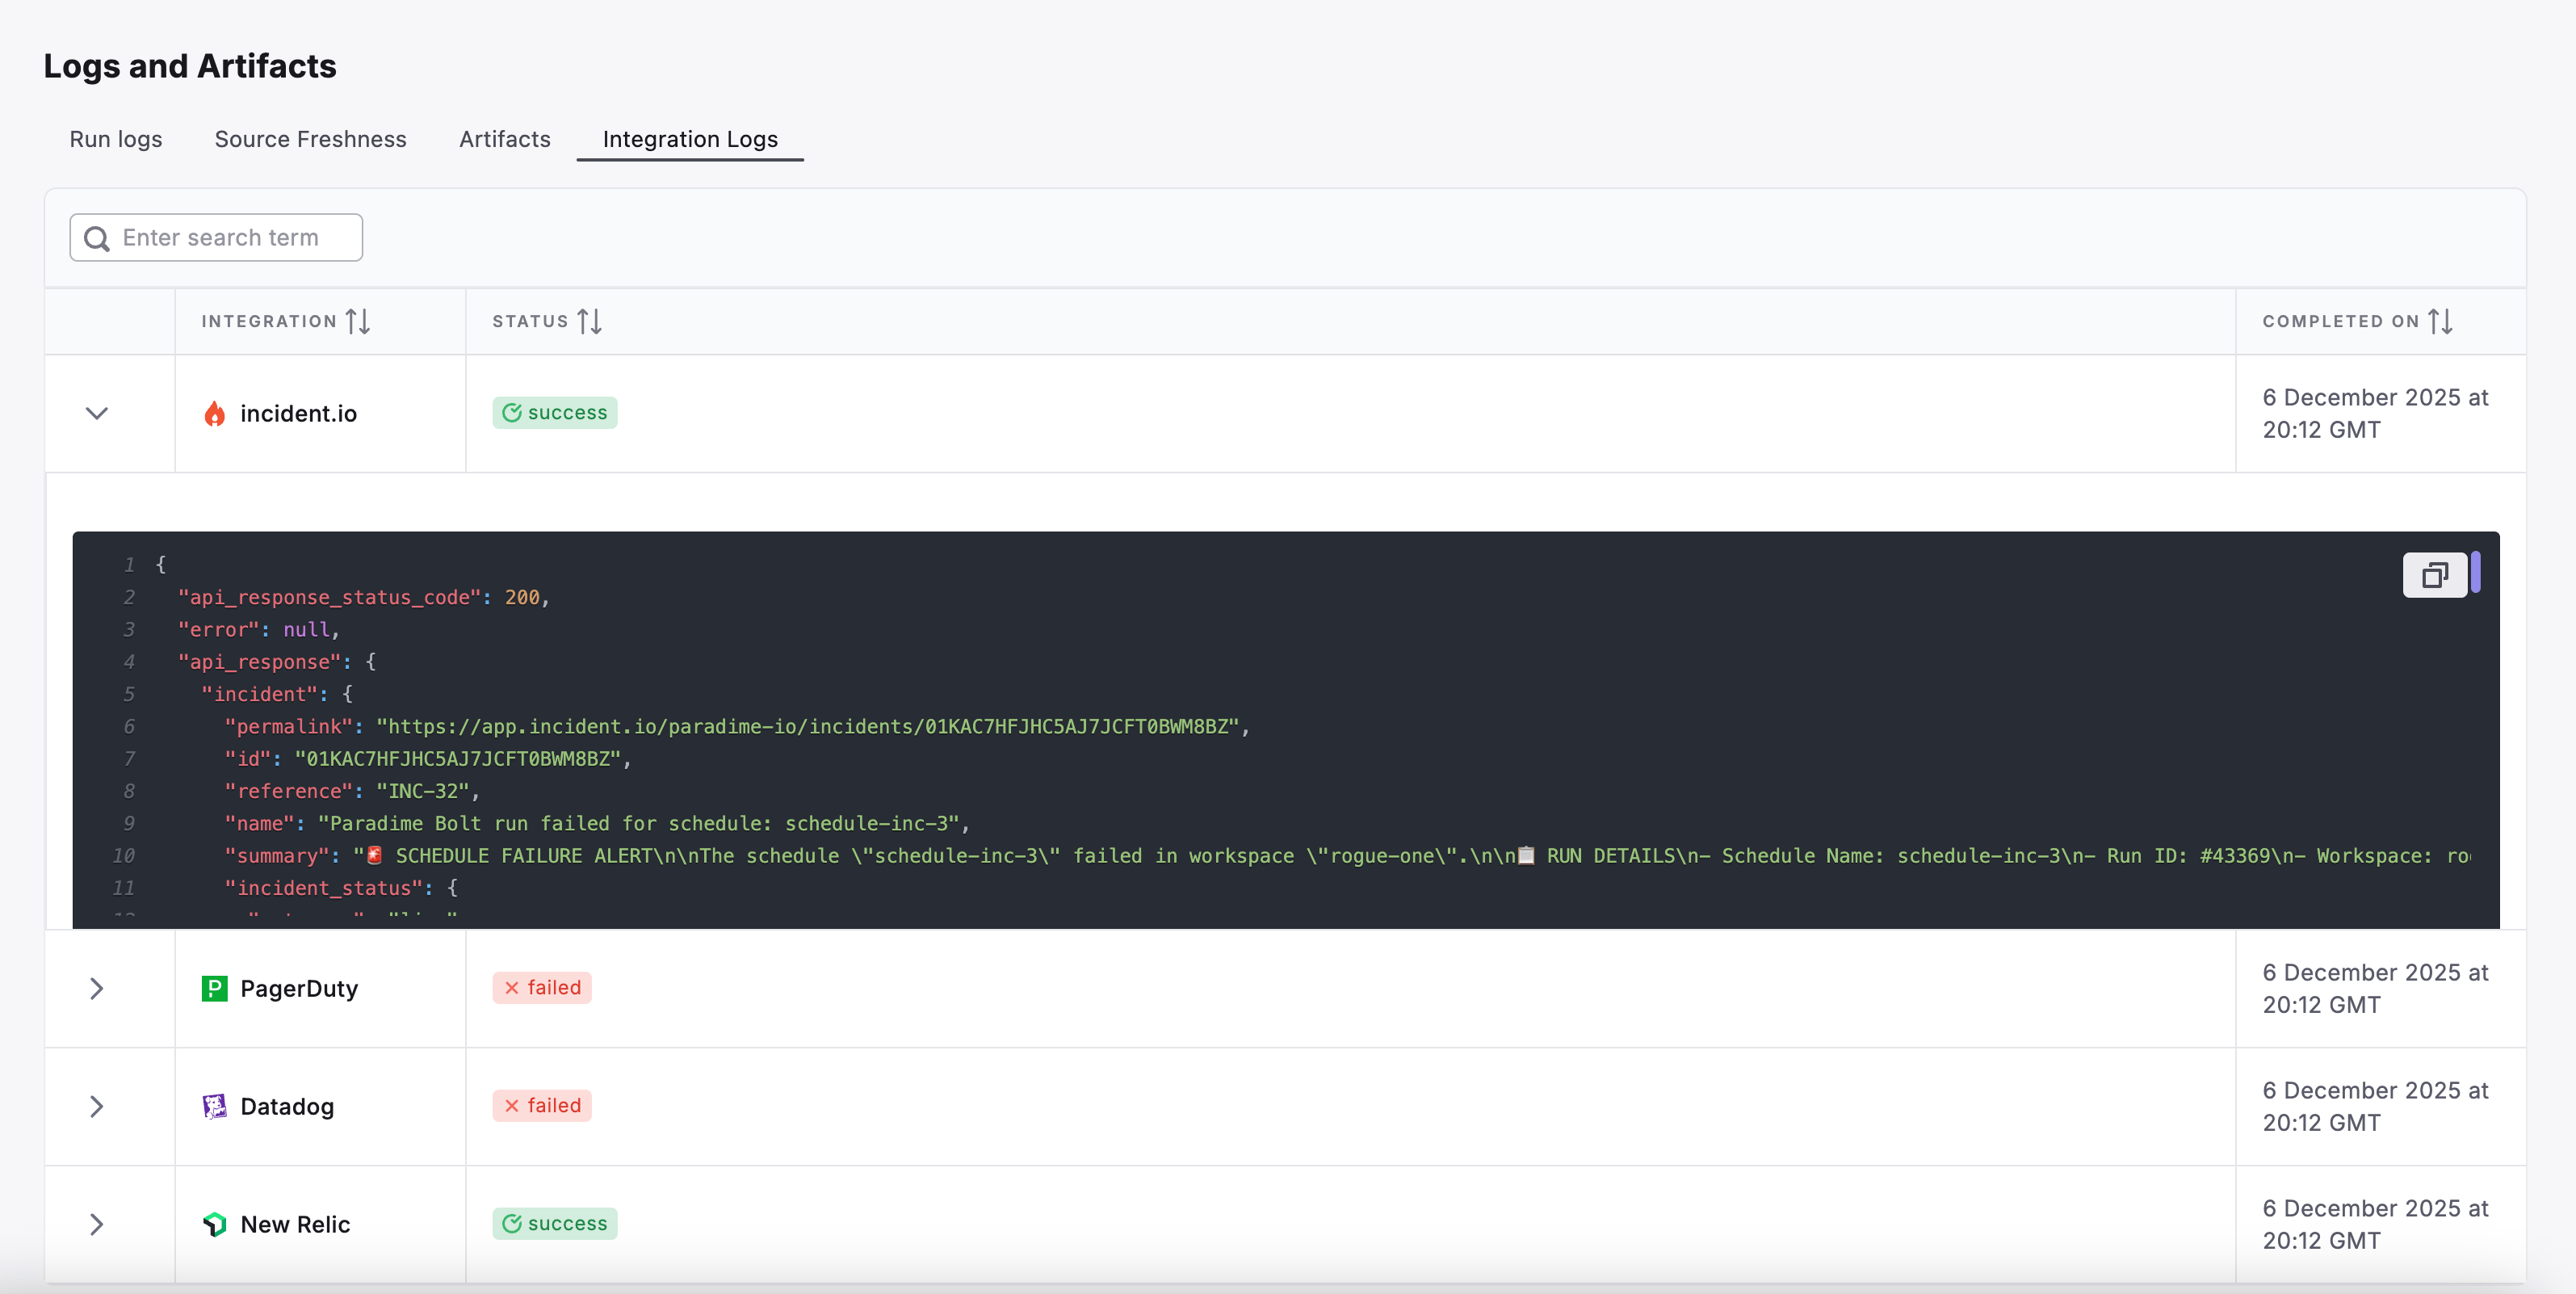
- Integration Logs
Overview
Displays high-level execution details for commands, showing the overall completion status, duration, and success metrics.Warnings and Errors
Lists any warnings or errors encountered during the run, such as deprecated configurations or unused paths.Suggested Actions
Recommendations to address identified warnings and errors, including updates for alignment with best practices.Use Case:
Quickly assess if the run was successful, spot any configuration issues, and take corrective actions.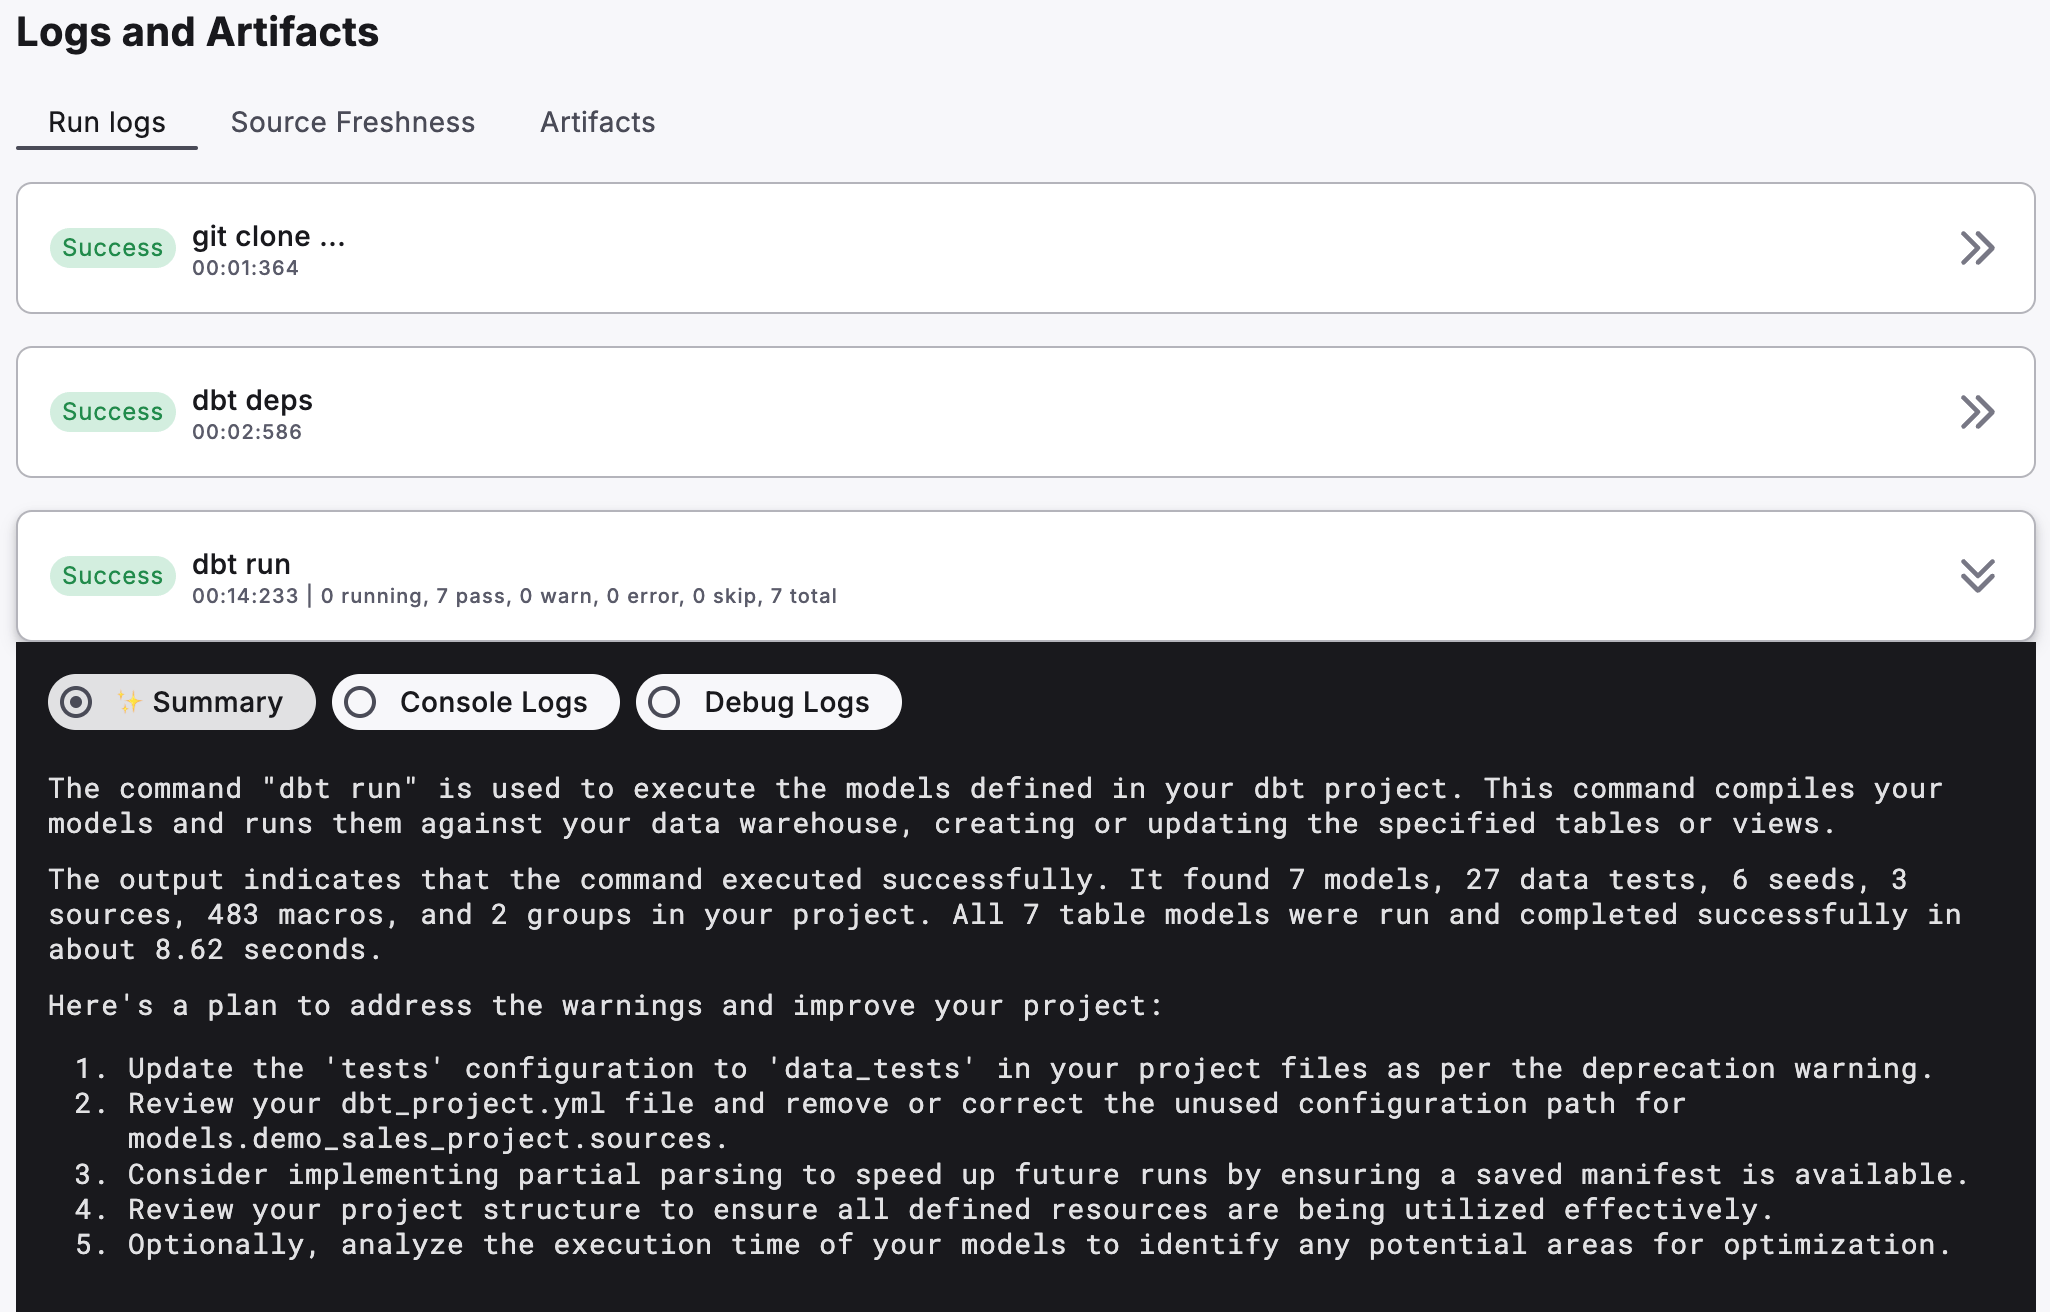
Displays high-level execution details for commands, showing the overall completion status, duration, and success metrics.Warnings and Errors
Lists any warnings or errors encountered during the run, such as deprecated configurations or unused paths.Suggested Actions
Recommendations to address identified warnings and errors, including updates for alignment with best practices.Use Case:
Quickly assess if the run was successful, spot any configuration issues, and take corrective actions.
Source Freshness
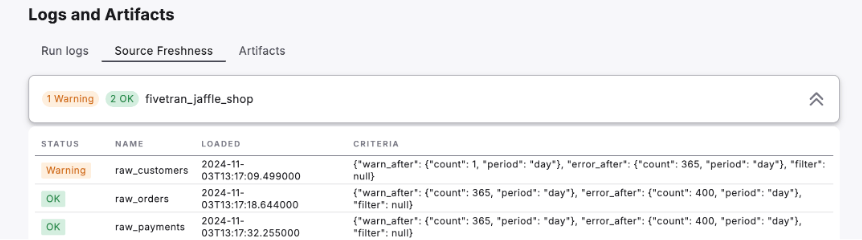
When your schedule includes thedbt source freshness command, you can:
- Monitor when each source table was last updated
- Track if data freshness meets your defined SLAs
- Identify stale or outdated data sources
💡 Learn how to configure source freshness in our documentation.
Artifacts
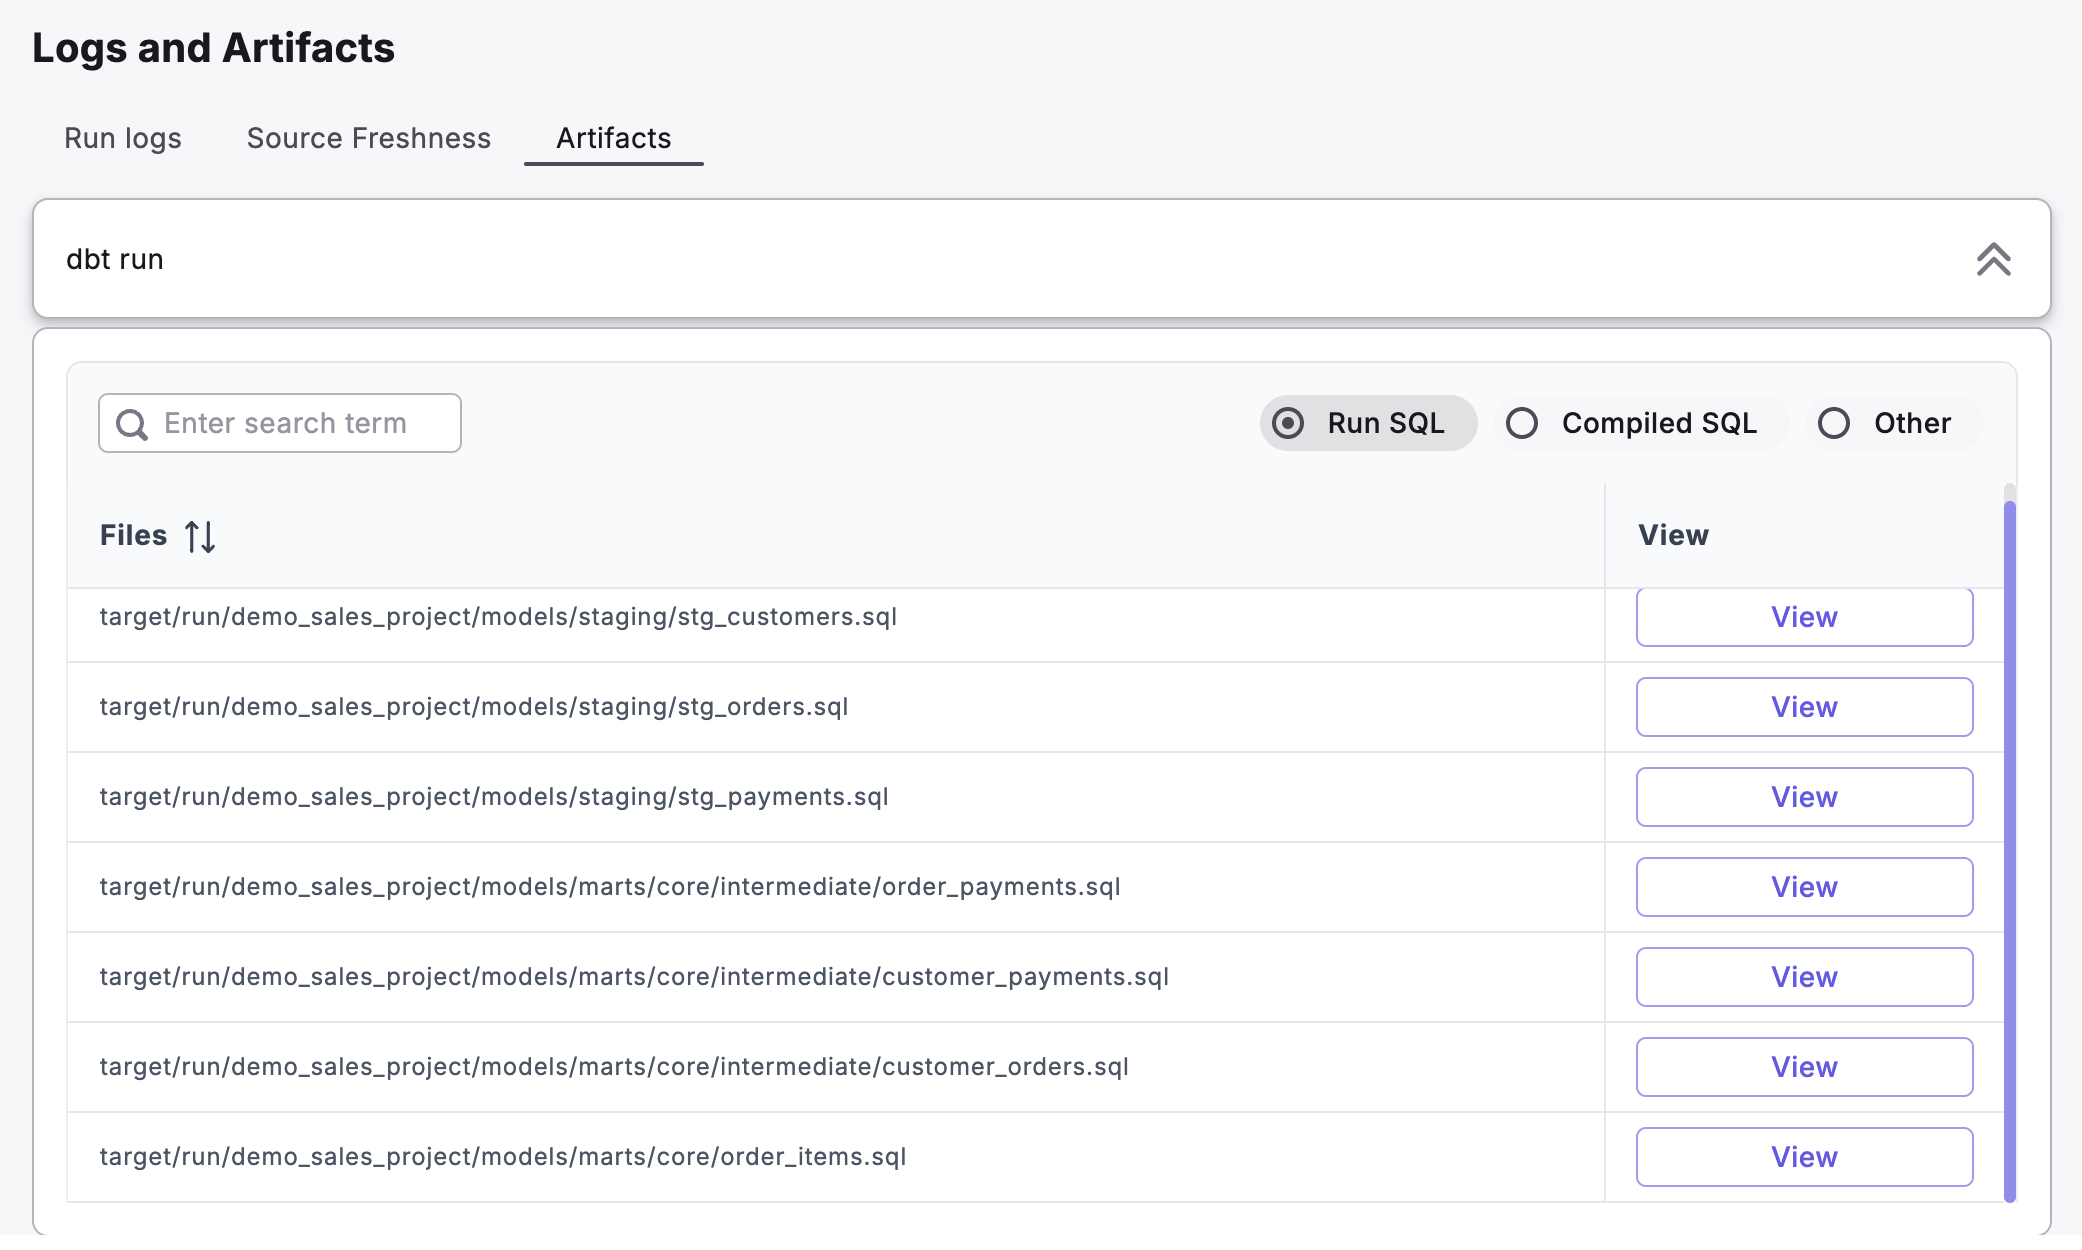
The Artifacts section provides access to files that dbt generates after each run. These files help you analyze and troubleshoot your workflows:SQL Files
- Run SQL - View the actual SQL statements executed during the run
- Compiled SQL - Examine the optimized SQL used in your data warehouse
Execution Metadata
manifest.json- Shows project structure (models, sources, and tests)catalog.json- Contains schema information and column detailsrun_results.json- Provides execution outcomes of dbt commandssources.json- Tracks source table metadata and freshness history
Use these artifacts to verify execution details, troubleshoot issues, and audit your dbt workflow performance.