> ## Documentation Index
> Fetch the complete documentation index at: https://docs.paradime.io/llms.txt
> Use this file to discover all available pages before exploring further.
# Analyzing Individual Run Details
> Deep dive into specific run executions with DAG visualizations, logs, and artifacts for thorough analysis.
export const Arcade = ({src, title}) =>
;
Investigate specific schedule executions to diagnose performance, troubleshoot issues, and verify data processing results.
Access these details by selecting a Run ID from the [Run History table](/products/bolt/managing-schedules/viewing-run-log-history#run-history).
### Run Details Overview
Analyze your run execution through different visualization tools:
#### DAGs View
Visualize the execution flow of scheduled commands through a directed acyclic graph (DAG), showing:
* **Command dependencies -** Understand which models must complete before others can start
* **Execution order -** Track the sequence of operations to optimize pipeline flow
* **Process relationships -** Identify critical paths and potential parallelization opportunities
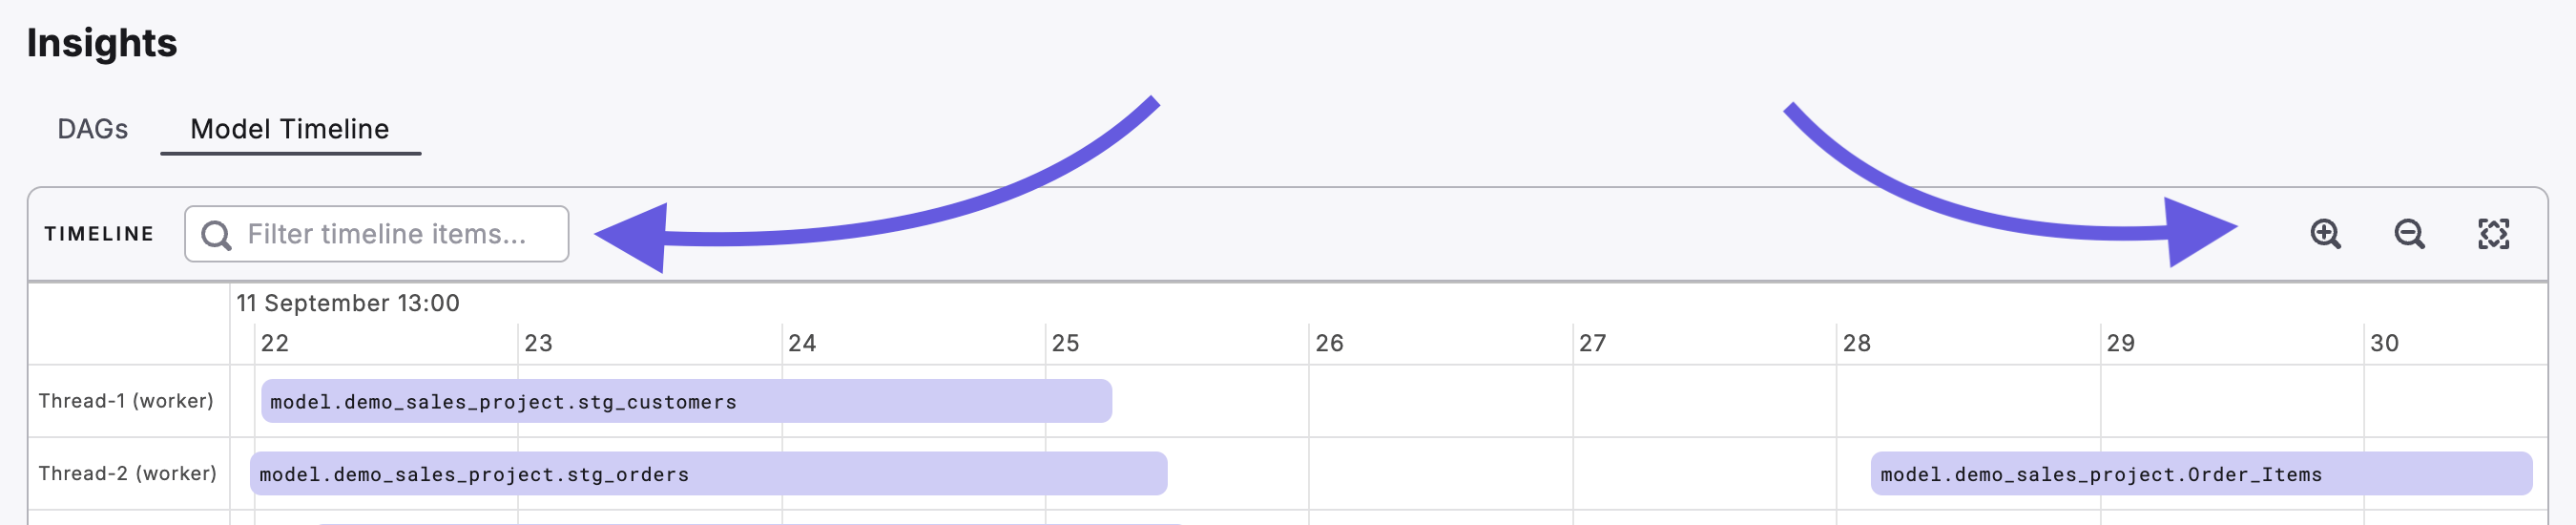
#### **Model Timeline**
Track the temporal sequence of model execution within your run:
* **Individual model execution times** - Spot which models are taking longer than expected
* **Parallel processing visualization** - See which models run simultaneously to maximize efficiency
* **Performance bottleneck identification** - Find slow-running models that delay your entire pipeline
**Enhanced Navigation:** The model timeline includes **search and filter functionality** to quickly locate specific models by name, plus **zoom controls** to focus on specific time periods or view the entire run at once.
 ***
### **Logs and Artifacts**
Explore additional metadata for each run ID, including a breakdown of run logs, source freshness, and artifacts.
#### Run Logs
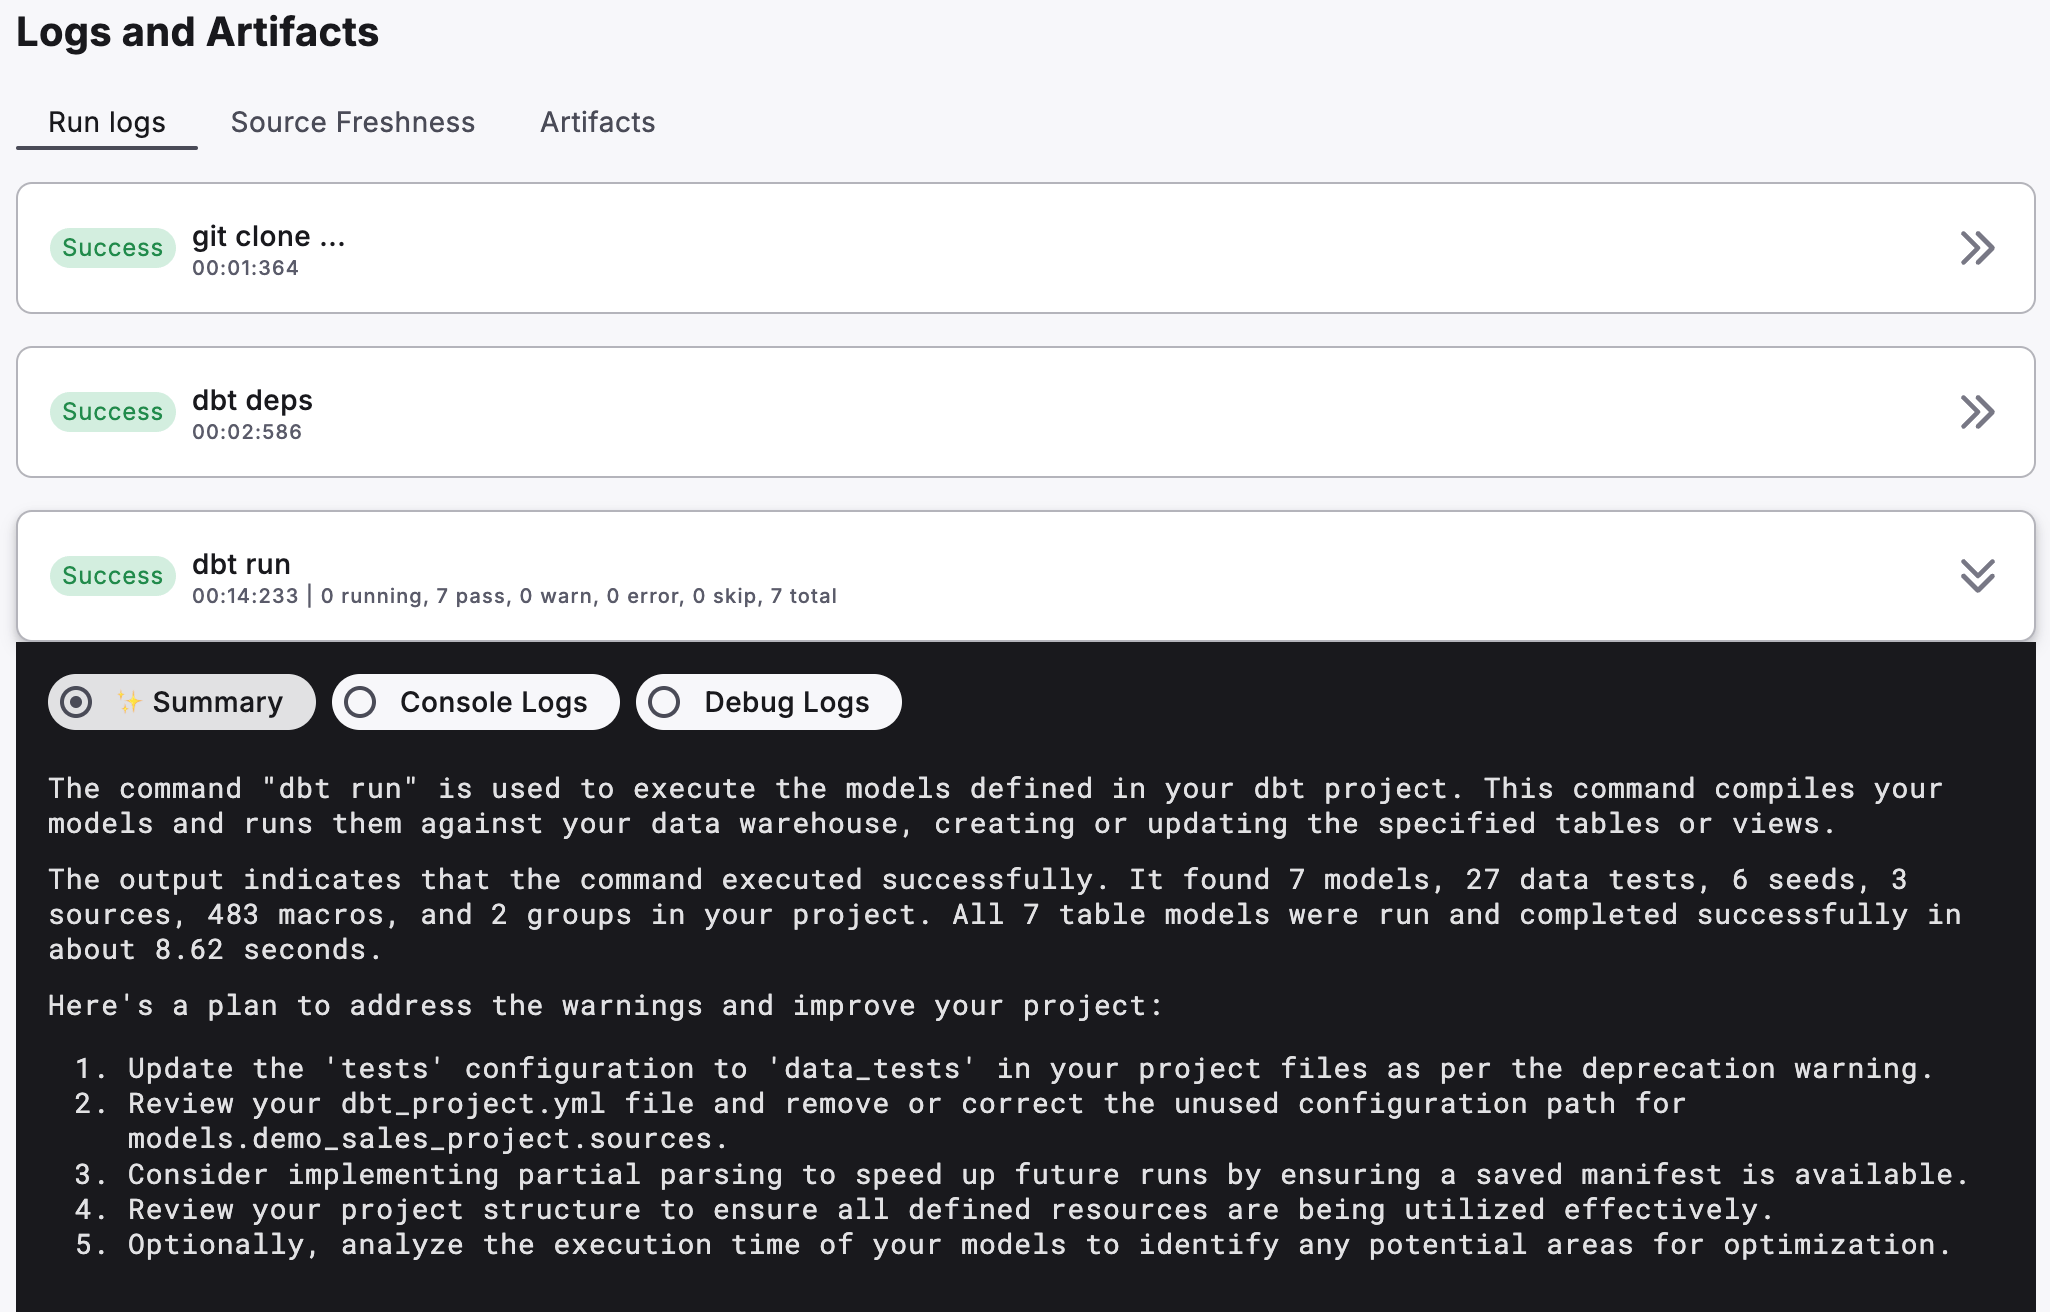
The **Run Logs** section provides a detailed breakdown of each scheduled run, offering insights into execution status, performance, and any encountered issues. This section is divided into three tabs: **Summary**, **Console Logs**, and **Debug Logs**.
**Overview**\
Displays high-level execution details for commands, showing the overall completion status, duration, and success metrics.
**Warnings and Errors**\
Lists any warnings or errors encountered during the run, such as deprecated configurations or unused paths.
**Suggested Actions**\
Recommendations to address identified warnings and errors, including updates for alignment with best practices.
**Use Case:**\
Quickly assess if the run was successful, spot any configuration issues, and take corrective actions.
***
### **Logs and Artifacts**
Explore additional metadata for each run ID, including a breakdown of run logs, source freshness, and artifacts.
#### Run Logs
The **Run Logs** section provides a detailed breakdown of each scheduled run, offering insights into execution status, performance, and any encountered issues. This section is divided into three tabs: **Summary**, **Console Logs**, and **Debug Logs**.
**Overview**\
Displays high-level execution details for commands, showing the overall completion status, duration, and success metrics.
**Warnings and Errors**\
Lists any warnings or errors encountered during the run, such as deprecated configurations or unused paths.
**Suggested Actions**\
Recommendations to address identified warnings and errors, including updates for alignment with best practices.
**Use Case:**\
Quickly assess if the run was successful, spot any configuration issues, and take corrective actions.
 **Overview**\
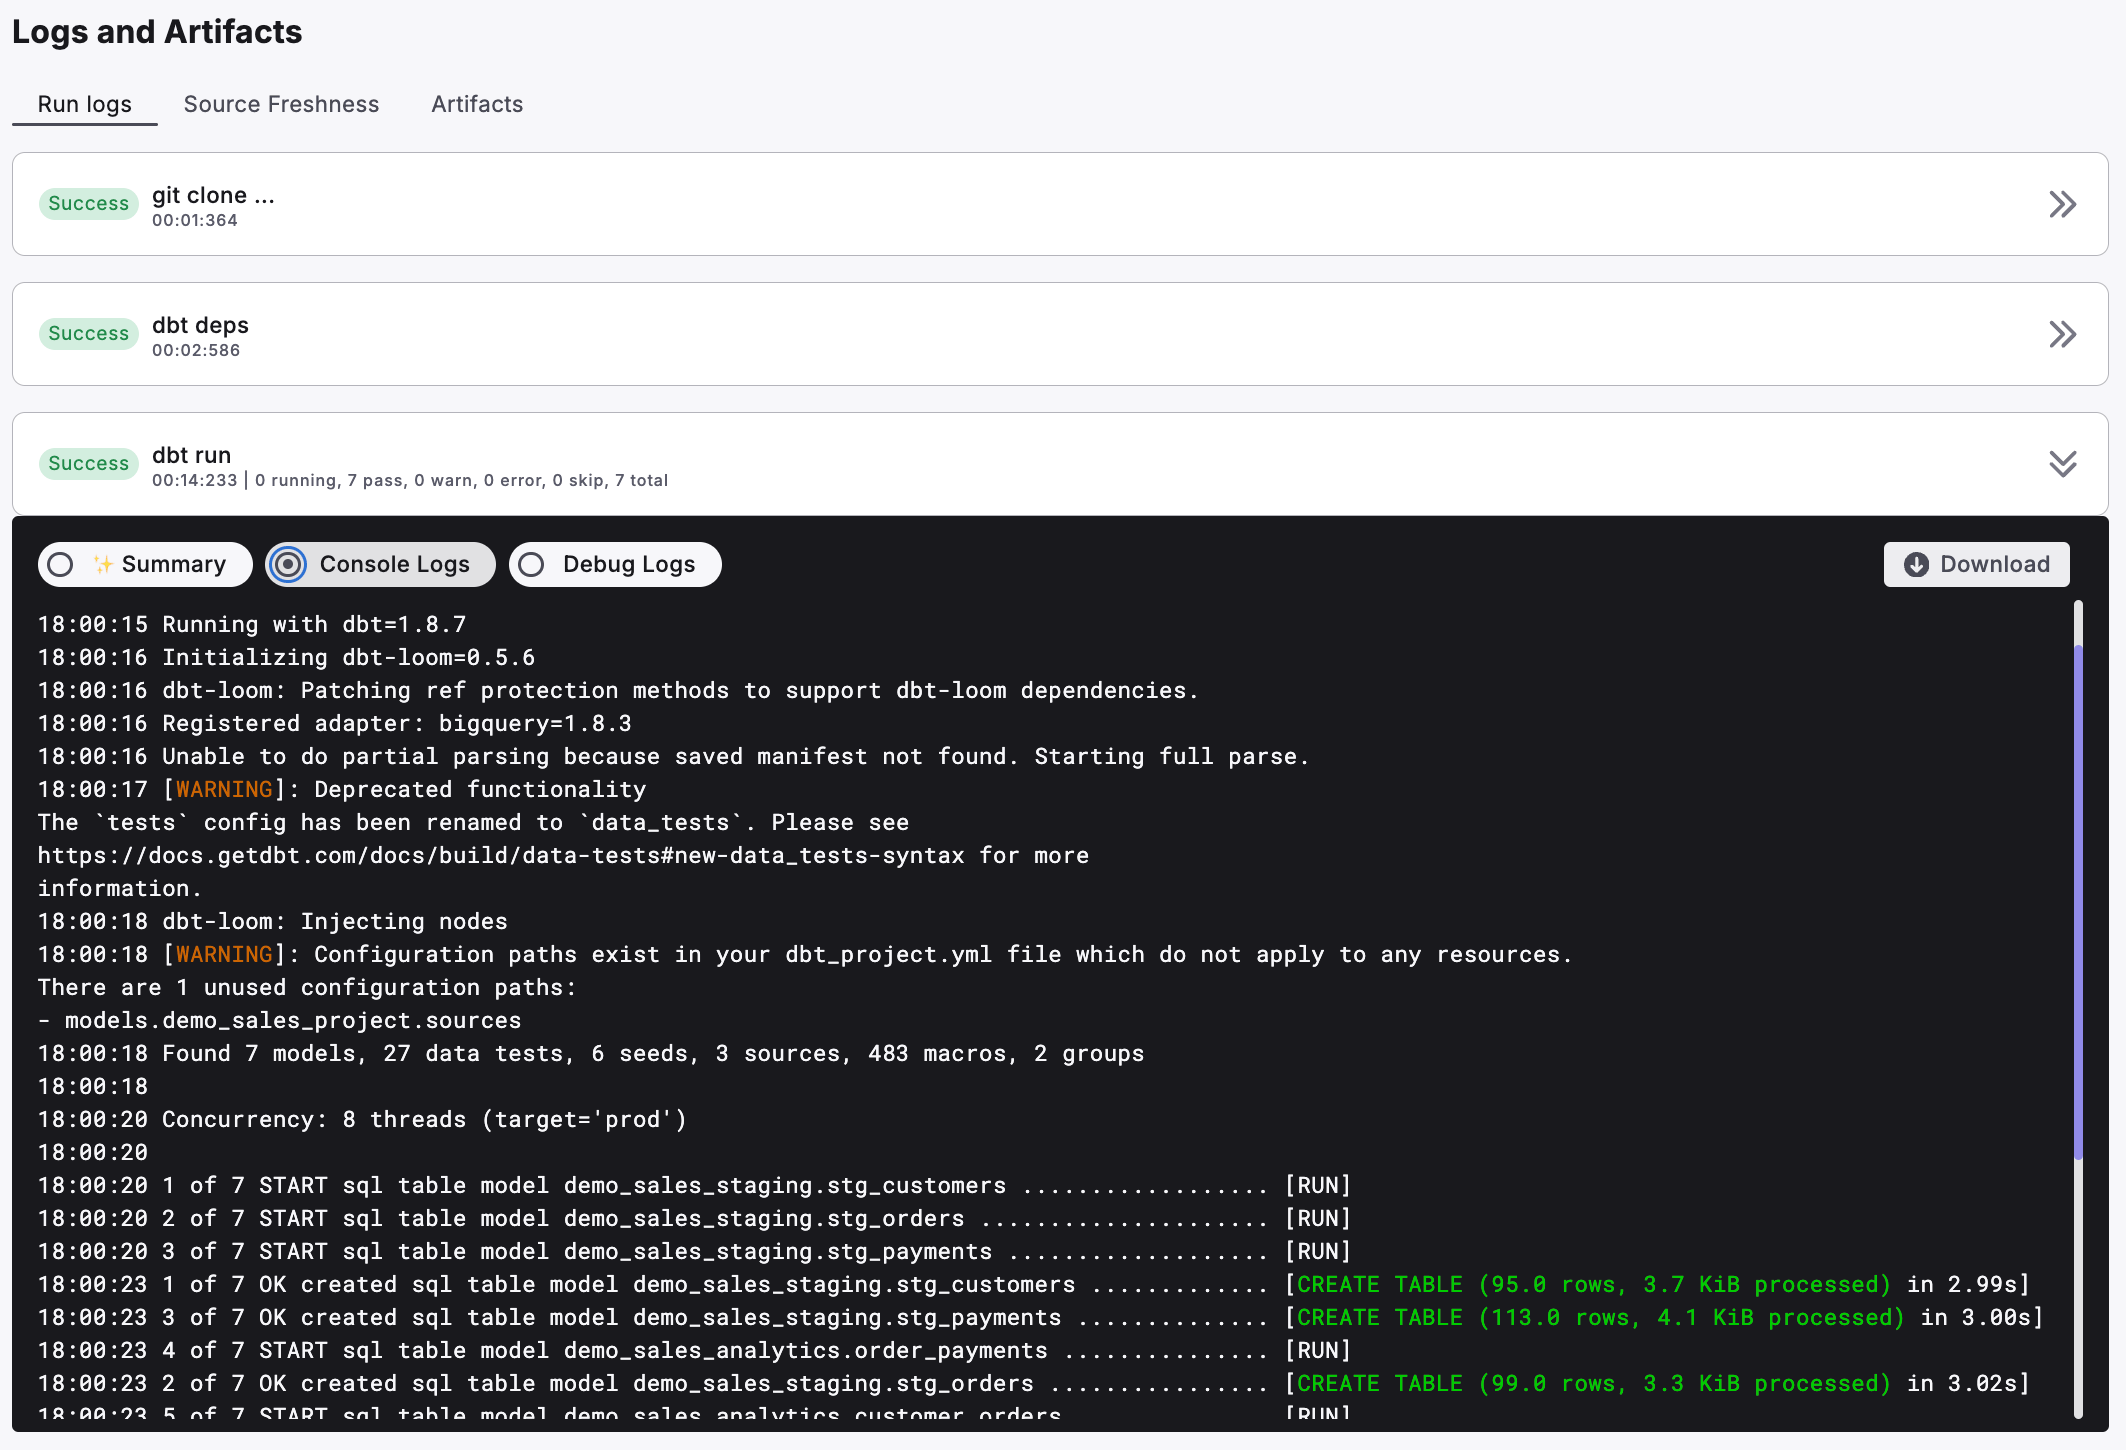
Shows a line-by-line output of the command execution, starting with initialization and progressing through each execution step, including model or task processing times and completion summaries.
**Use Case**\
Ideal for reviewing the detailed flow of the run, identifying stages where issues may have occurred, and monitoring performance.
**Overview**\
Shows a line-by-line output of the command execution, starting with initialization and progressing through each execution step, including model or task processing times and completion summaries.
**Use Case**\
Ideal for reviewing the detailed flow of the run, identifying stages where issues may have occurred, and monitoring performance.
 **Overview**\
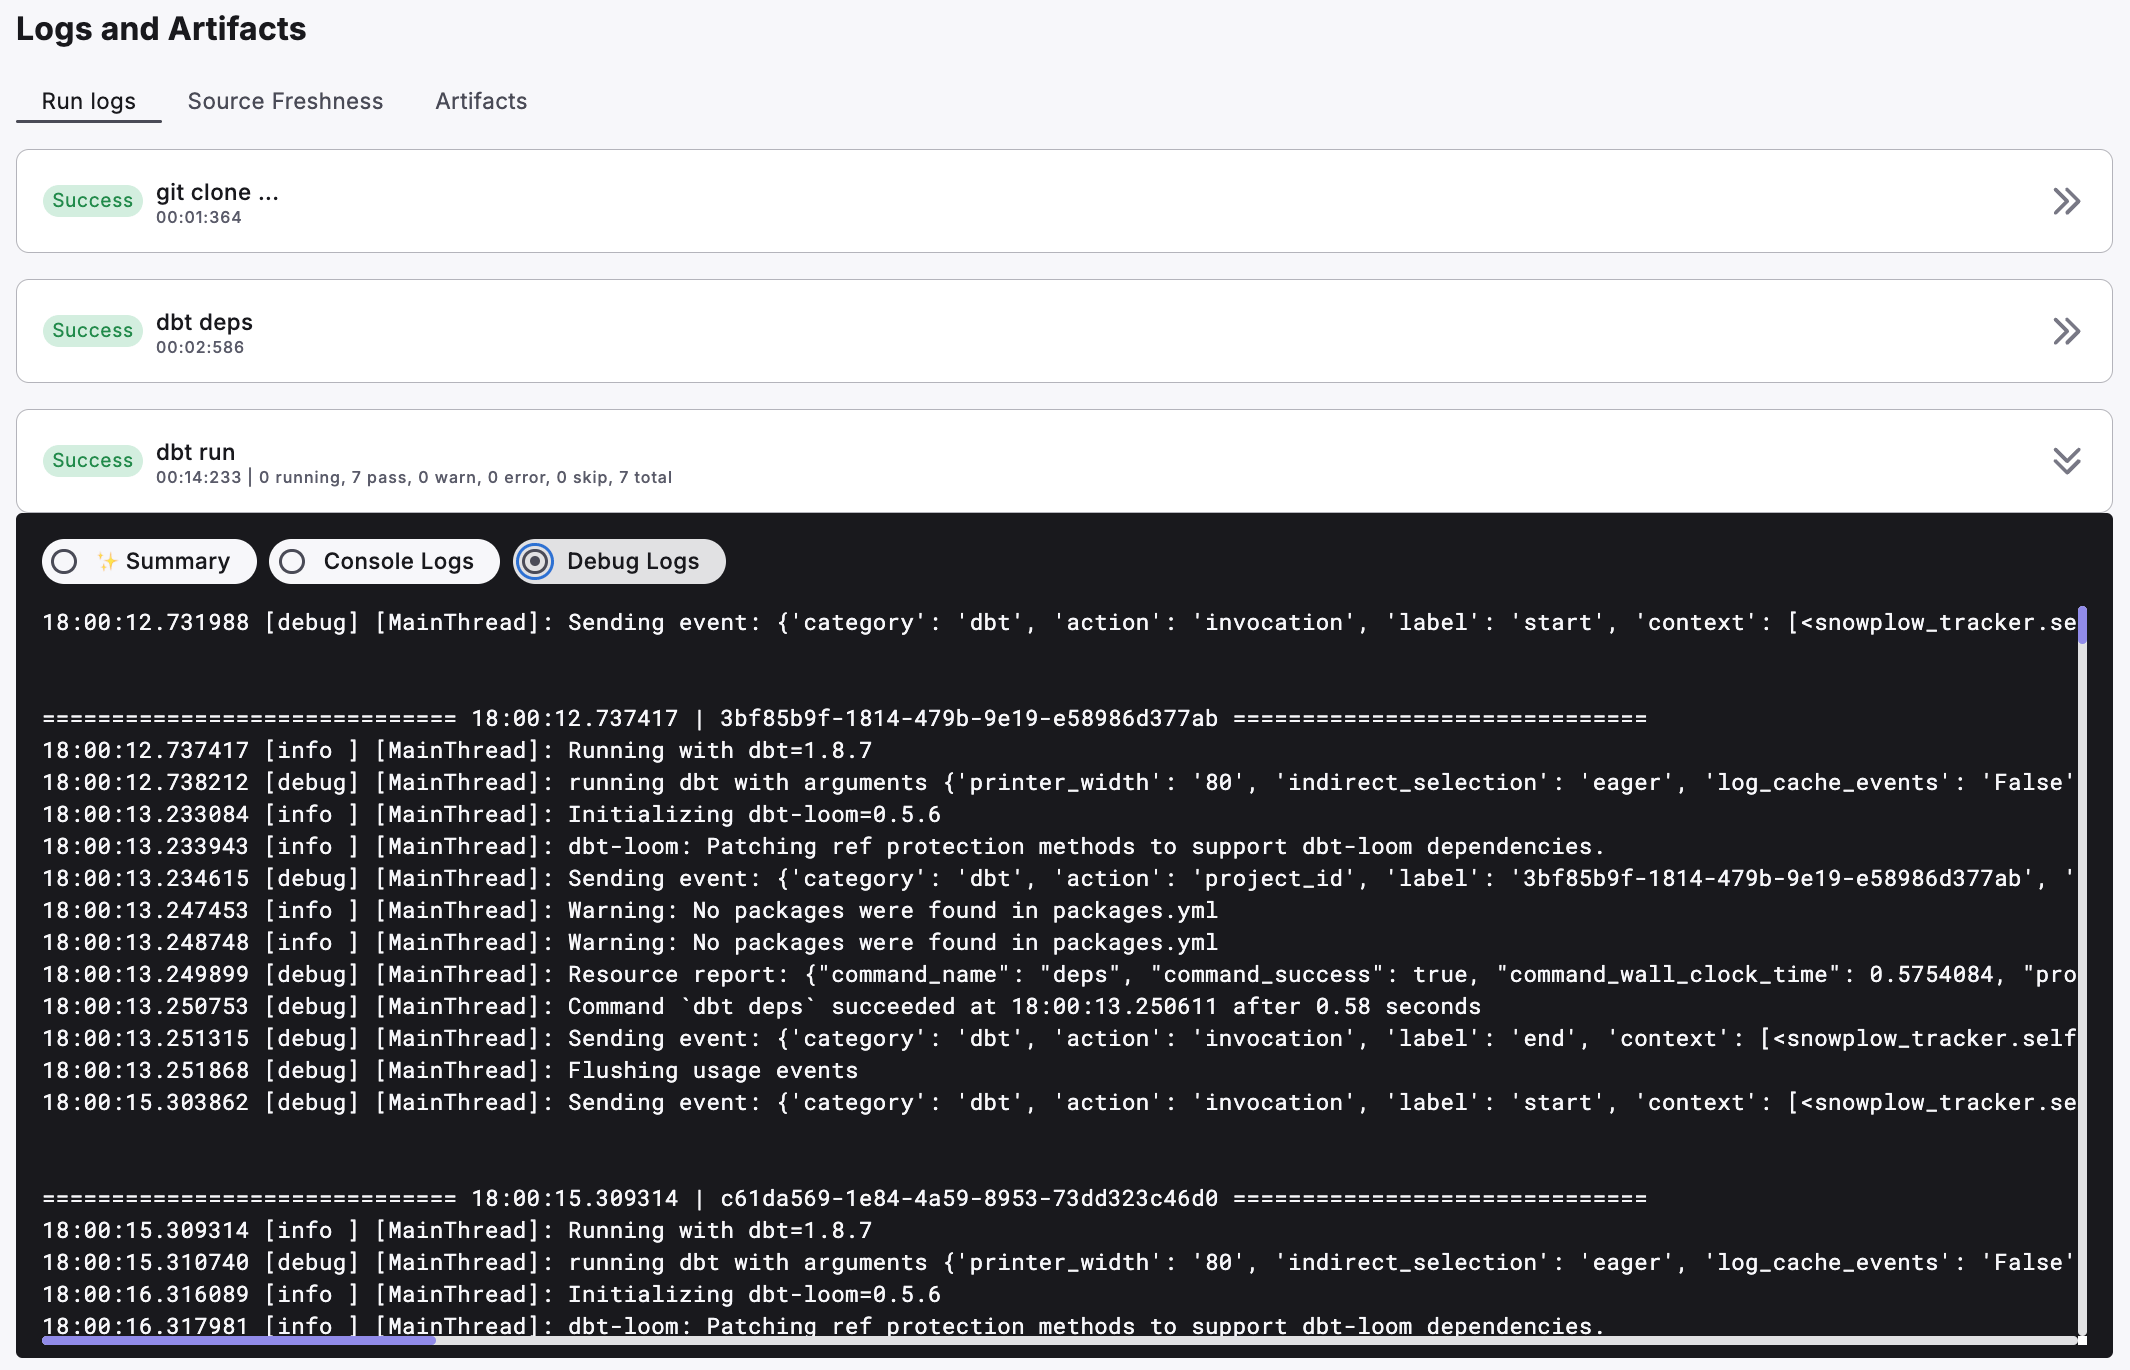
Provides in-depth technical details, including system interactions, resource allocation, thread usage, and connection status to support troubleshooting.
**Use Case:**\
Best for advanced diagnostics and analyzing system performance, especially when investigating anomalies or unexpected behaviors.
**Overview**\
Provides in-depth technical details, including system interactions, resource allocation, thread usage, and connection status to support troubleshooting.
**Use Case:**\
Best for advanced diagnostics and analyzing system performance, especially when investigating anomalies or unexpected behaviors.
 **Overview**\
Provides in-depth logs of the payload sent to the connected integrations after the Bolt Run completed.
**Use Case:**\
Best for checking/validating the status of the integration sync, as well as the metadata being sent.
**Overview**\
Provides in-depth logs of the payload sent to the connected integrations after the Bolt Run completed.
**Use Case:**\
Best for checking/validating the status of the integration sync, as well as the metadata being sent.
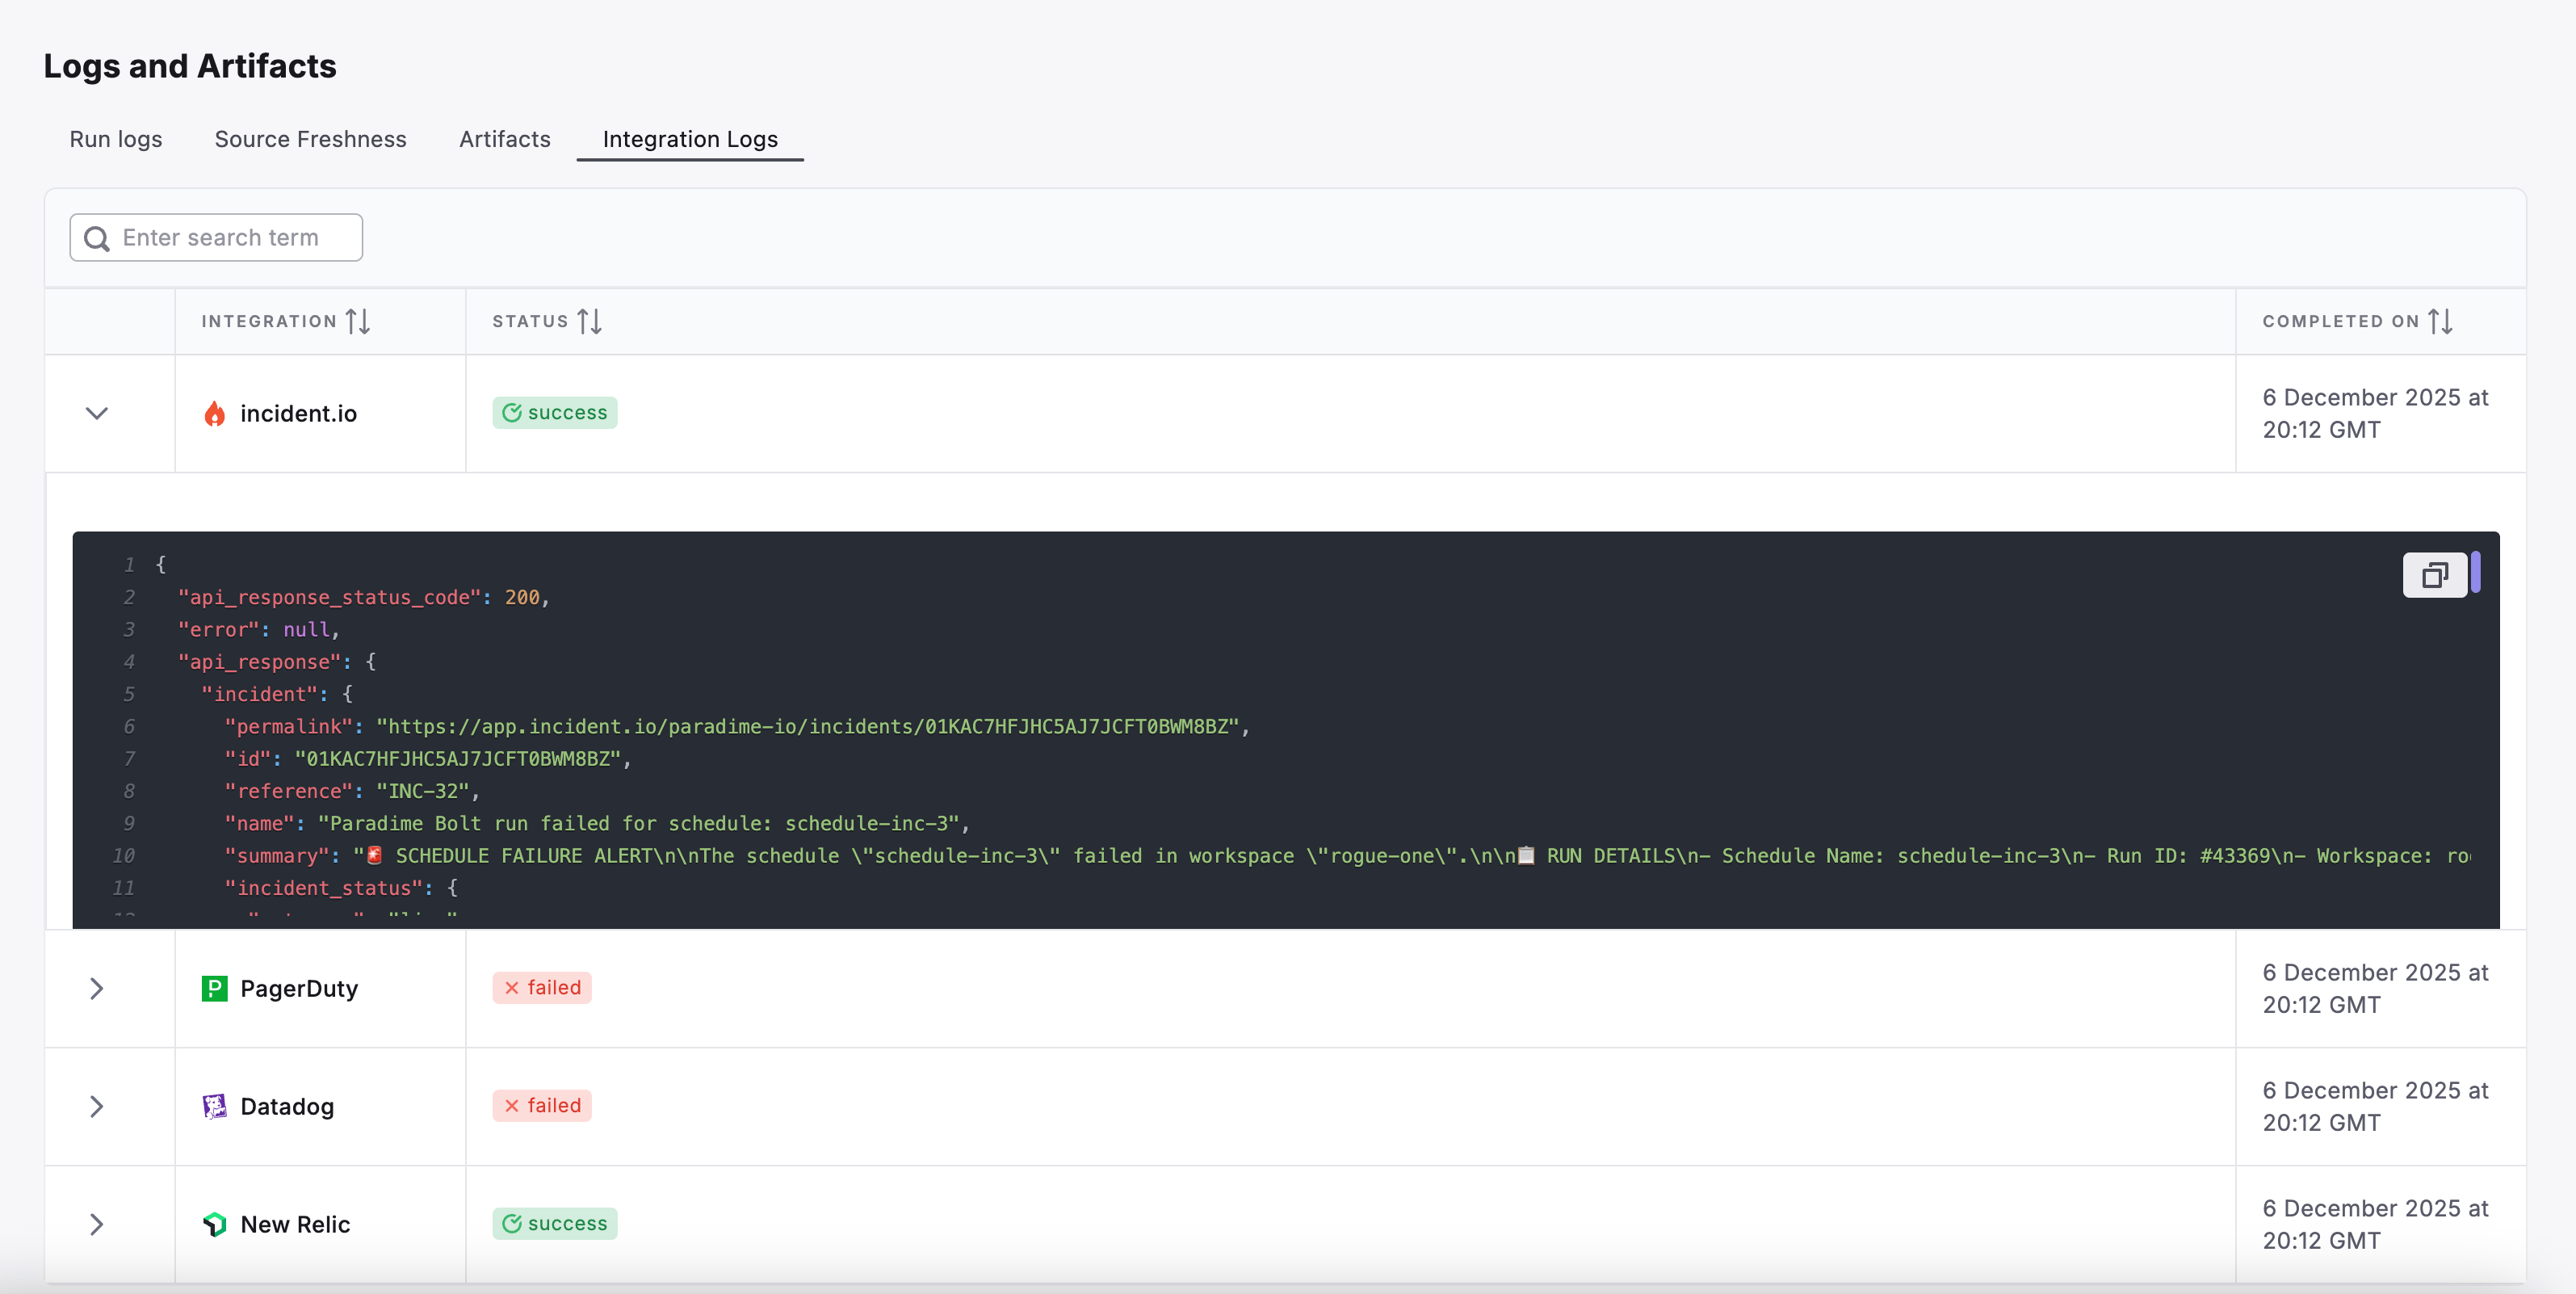 Each tab gives a targeted view of run details, offering a complete understanding of pipeline performance.
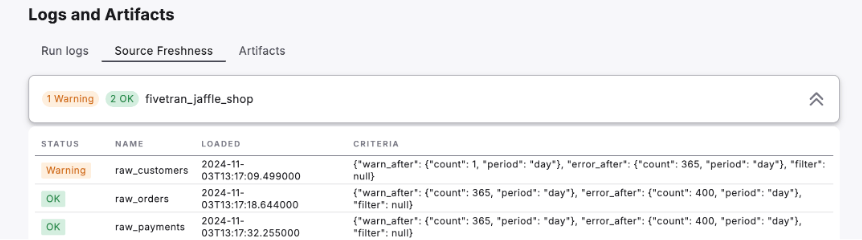
#### Source Freshness
When your schedule includes the `dbt source freshness` command, you can:
* Monitor when each source table was last updated
* Track if data freshness meets your defined SLAs
* Identify stale or outdated data sources
Each tab gives a targeted view of run details, offering a complete understanding of pipeline performance.
#### Source Freshness
When your schedule includes the `dbt source freshness` command, you can:
* Monitor when each source table was last updated
* Track if data freshness meets your defined SLAs
* Identify stale or outdated data sources
 💡 Learn how to configure source freshness in our [documentation](/products/bolt/managing-schedules/analyzing-run-details/configuring-source-freshness#how-to-configure-source-freshness).
#### Artifacts
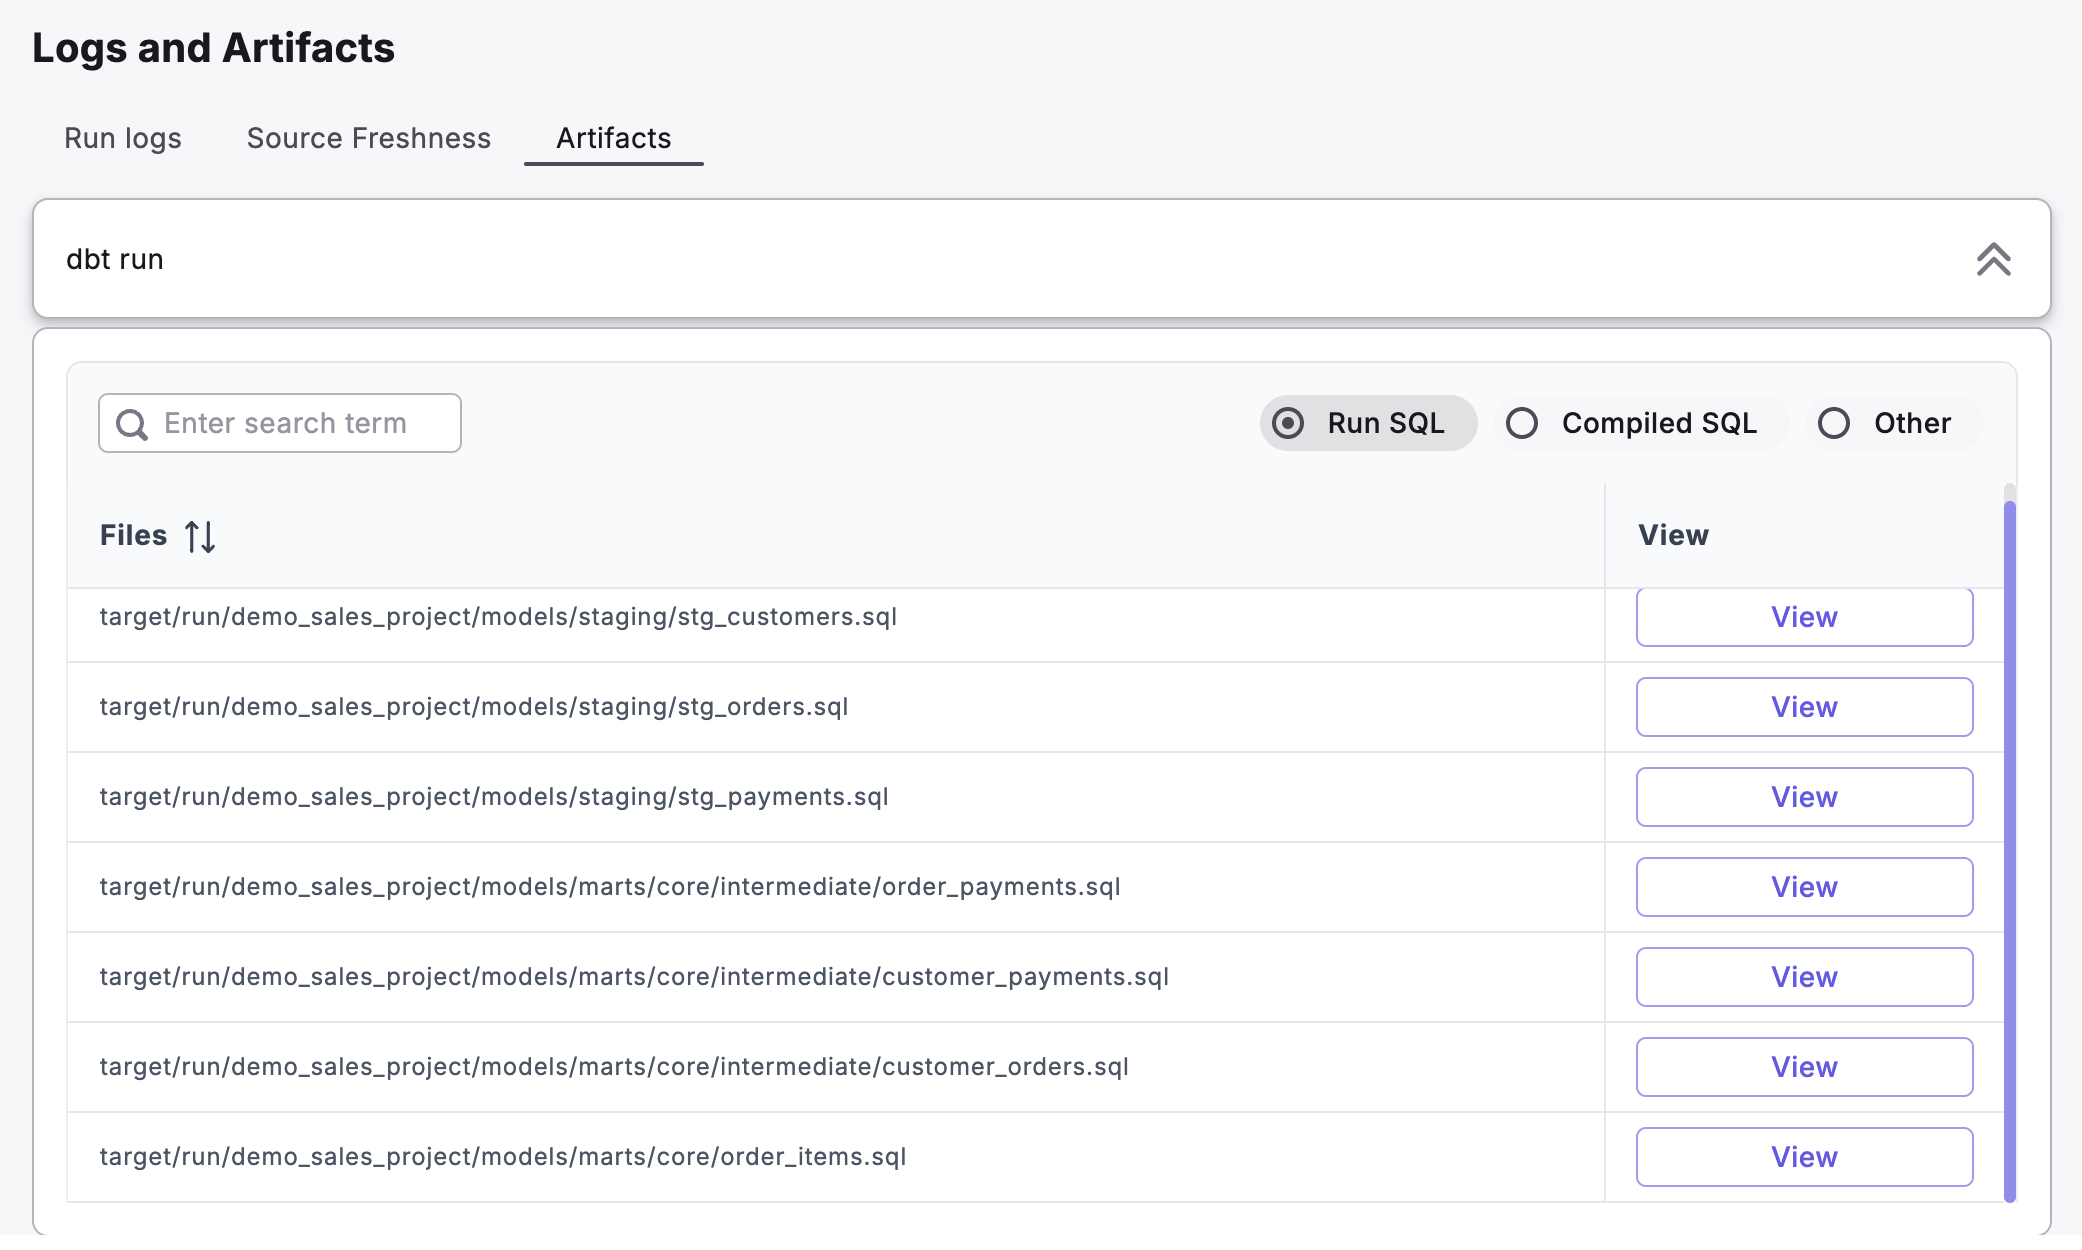
The **Artifacts** section provides access to files that dbt generates after each run. These files help you analyze and troubleshoot your workflows:
#### SQL Files
* **Run SQL** - View the actual SQL statements executed during the run
* **Compiled SQL** - Examine the optimized SQL used in your data warehouse
#### Execution Metadata
* `manifest.json` - Shows project structure (models, sources, and tests)
* `catalog.json` - Contains schema information and column details
* `run_results.json` - Provides execution outcomes of dbt commands
* `sources.json` - Tracks source table metadata and freshness history
Use these artifacts to verify execution details, troubleshoot issues, and audit your dbt workflow performance.
💡 Learn how to configure source freshness in our [documentation](/products/bolt/managing-schedules/analyzing-run-details/configuring-source-freshness#how-to-configure-source-freshness).
#### Artifacts
The **Artifacts** section provides access to files that dbt generates after each run. These files help you analyze and troubleshoot your workflows:
#### SQL Files
* **Run SQL** - View the actual SQL statements executed during the run
* **Compiled SQL** - Examine the optimized SQL used in your data warehouse
#### Execution Metadata
* `manifest.json` - Shows project structure (models, sources, and tests)
* `catalog.json` - Contains schema information and column details
* `run_results.json` - Provides execution outcomes of dbt commands
* `sources.json` - Tracks source table metadata and freshness history
Use these artifacts to verify execution details, troubleshoot issues, and audit your dbt workflow performance.
 ## Related topics
- [Analyzing Individual Run Details](/products/bolt/managing-schedules/analyzing-run-details/index.md)
- [Retrying a Failed Run](/products/bolt/managing-schedules/retrying-a-failed-run.md)
- [Viewing Run Log History](/products/bolt/managing-schedules/viewing-run-log-history.md)
- [Build and Test Models with New Source Data](/products/bolt/creating-schedules/templates/dbt-tm-templates/deferred-model-execution.md)
- [Deploy Code Changes On Merge](/products/bolt/creating-schedules/templates/ci-cd-templates/deploy-code-changes-on-merge.md)
## Related topics
- [Analyzing Individual Run Details](/products/bolt/managing-schedules/analyzing-run-details/index.md)
- [Retrying a Failed Run](/products/bolt/managing-schedules/retrying-a-failed-run.md)
- [Viewing Run Log History](/products/bolt/managing-schedules/viewing-run-log-history.md)
- [Build and Test Models with New Source Data](/products/bolt/creating-schedules/templates/dbt-tm-templates/deferred-model-execution.md)
- [Deploy Code Changes On Merge](/products/bolt/creating-schedules/templates/ci-cd-templates/deploy-code-changes-on-merge.md)