

- Explores: Analyzes usage and costs at the Explore level. [link]
- Dashboards: Provides insights into dashboard usage and associated costs. [link]
Explores Section
The Explores section offers a comprehensive view of your Looker Explore usage and associated costs:1. Daily Spend Analysis
Value: Understand daily spending patterns across Explores and models.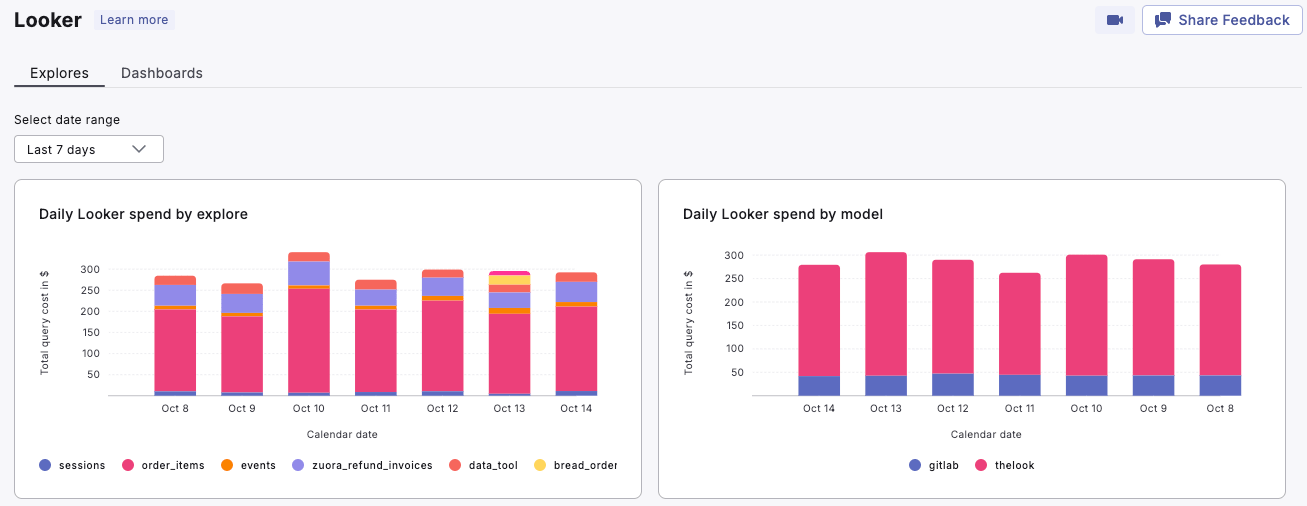
How to use:
- Monitor daily spend trends to identify any unusual spikes or patterns.
- Compare spend across different Explores and models to prioritize optimization efforts.
- Use this information to guide resource allocation and cost management strategies.
2. Top Spenders
Value: Identify the most expensive Explores and models.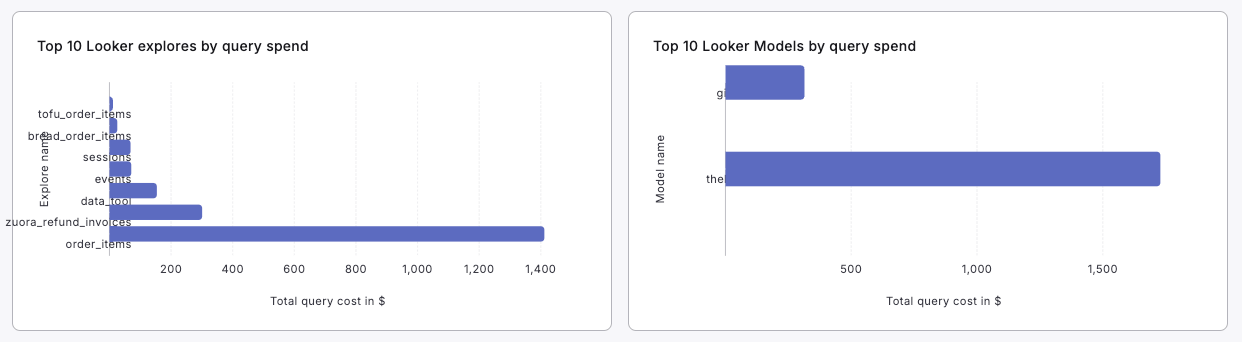
How to use:
- Focus optimization efforts on the Explores and models with the highest query costs.
- Investigate high-cost Explores to determine if they can be optimized or if their usage justifies the cost.
- Consider restructuring or optimizing expensive models to reduce overall costs.
3. Usage Patterns
Value: Visualize daily usage patterns of Looker Explores.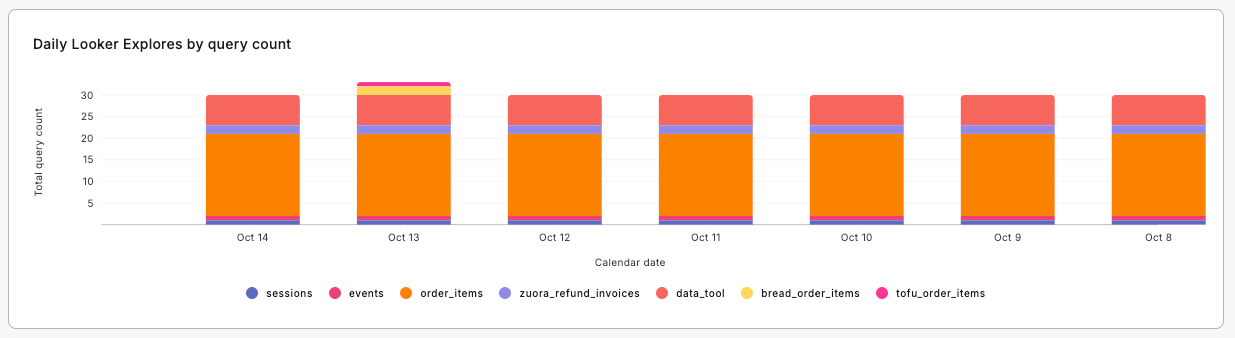
How to use:
- Identify the most frequently used Explores.
- Correlate usage patterns with spend to ensure high-use Explores are optimized for performance and cost.
- Consider deprecating or archiving consistently unused Explores.
Dashboards Section
The Dashboards section provides insights into Looker dashboard usage and associated costs:1. Dashboard Spend Analysis
Value: Understand daily spending on Looker dashboards.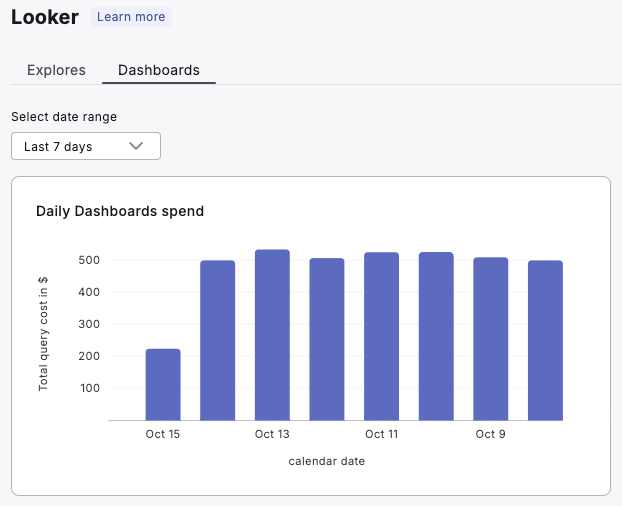
How to use:
- Monitor daily dashboard spend trends to identify any unusual patterns or spikes.
- Use this information to guide budget allocation and cost control measures for dashboard development and maintenance.
2. Top Dashboard Spenders
Value: Identify the most expensive Looker dashboards.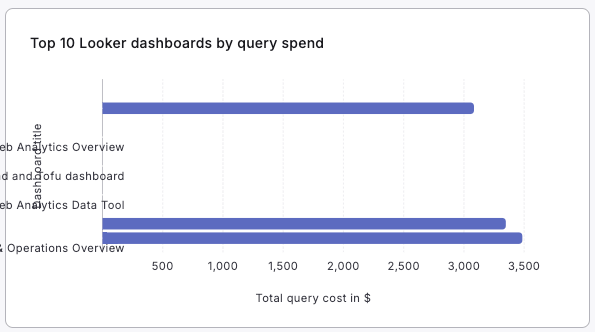
How to use:
- Focus optimization efforts on the dashboards with the highest query costs.
- Investigate high-cost dashboards to determine if they can be optimized or if their usage justifies the cost.
- Consider restructuring or consolidating expensive dashboards to reduce overall costs.
3. Active Dashboard Usage
Value: Analyze the usage and performance of active Looker dashboards.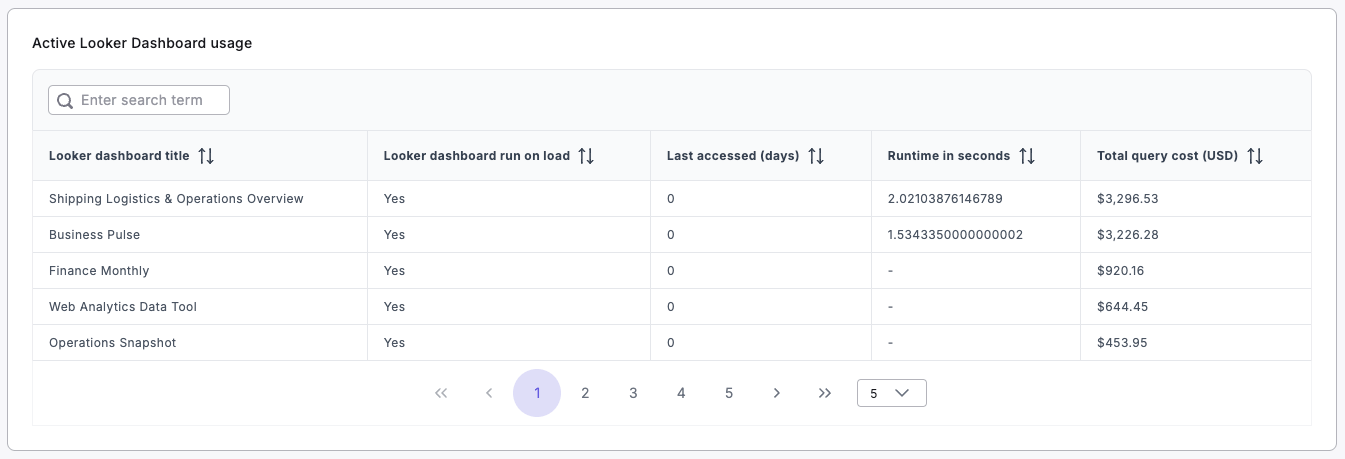
How to use:
- Review the “Last accessed” column to identify potentially unused or underutilized dashboards.
- Analyze runtime and query cost to identify dashboards that may need performance optimization.
- Use the “run on load” information to understand which dashboards are set to update automatically, potentially impacting costs.
How to Apply Filters
- Locate the “Select date range” dropdown at the top of both Explores and Dashboards sections.
- Choose your desired time frame for analysis.
- The dashboard will automatically update to reflect your selection, allowing for focused analysis over specific periods.