

Prerequisites
- Access to Bolt in your Paradime workspace.
- At least one configured Bolt schedule.
Schedules overview
The Bolt home screen summarizes every schedule (UI-based and YAML-based): name, status, owner, cron description and configuration, last run, next run, time until next run, trigger type, and on-completion configuration.Open a schedule’s detail view
1
Select a schedule
From the schedules overview, select a schedule name to open its detail view: configuration, run history, logs, and artifacts.
2
Read the run history
The Run history section lists every execution with its status, trigger (manual or automatic), branch and commit, run time, duration, and run ID.
3
Open logs and artifacts
Select a run, then scroll to Logs and artifacts. Select an executed command (for example
dbt run) to open its logs:Source freshness and artifacts
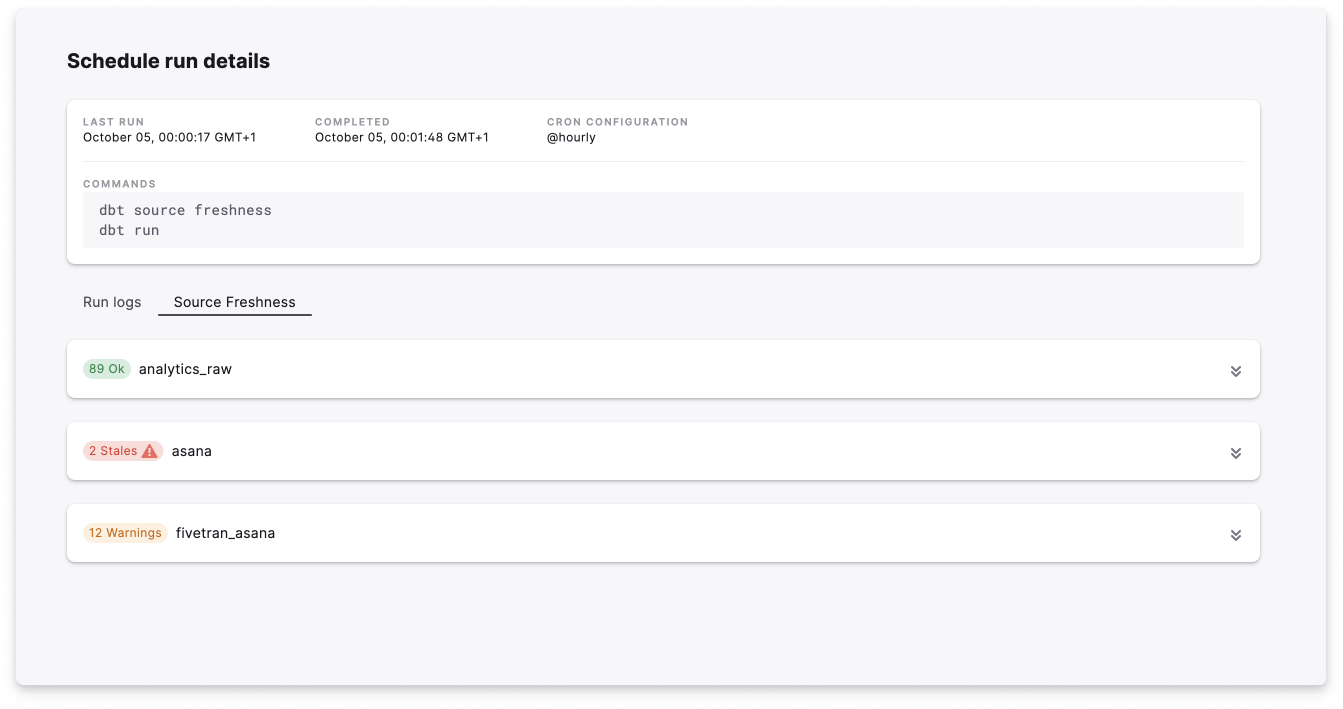
When a schedule runsdbt source freshness, Paradime shows the state of each source so you can check it against your SLAs.
manifest.json, and other JSON files) so you can analyze exactly what executed.
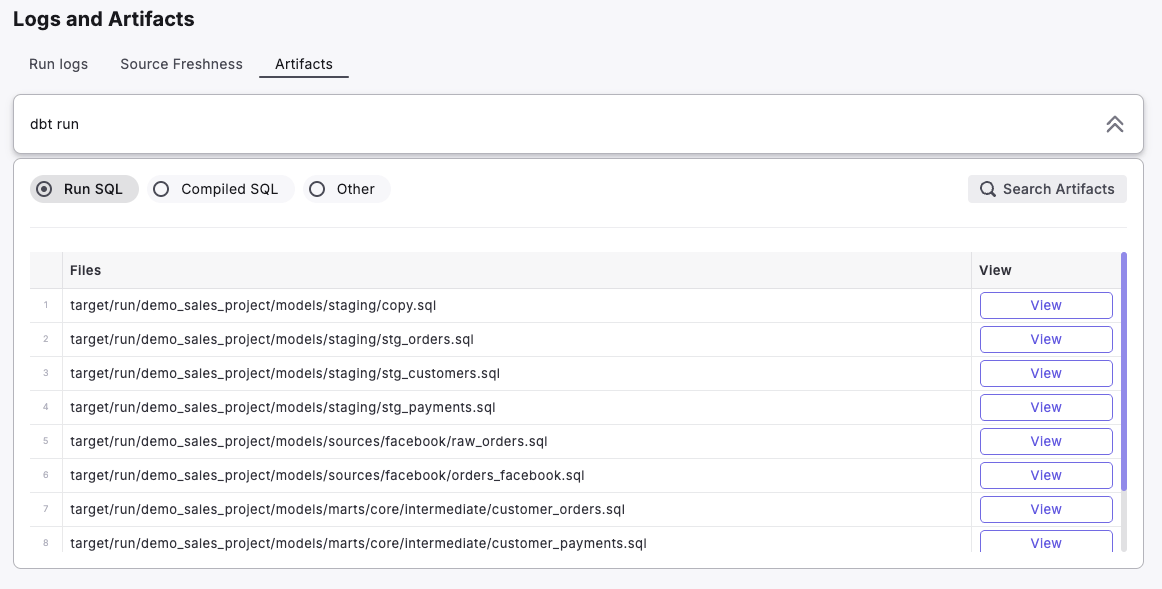
Opening a run shows its status, logs, and artifacts. For a failed run, the console logs contain the error and the compiled SQL that failed.
Next steps
Debug a failed run
Find and fix the root cause of a failure.
Run details reference
Every field in a run’s detail view.