

Lineage lives in the Data Catalog. Open any asset and select its Lineage tab to see its dependencies. This section explains how to read and work with that view.
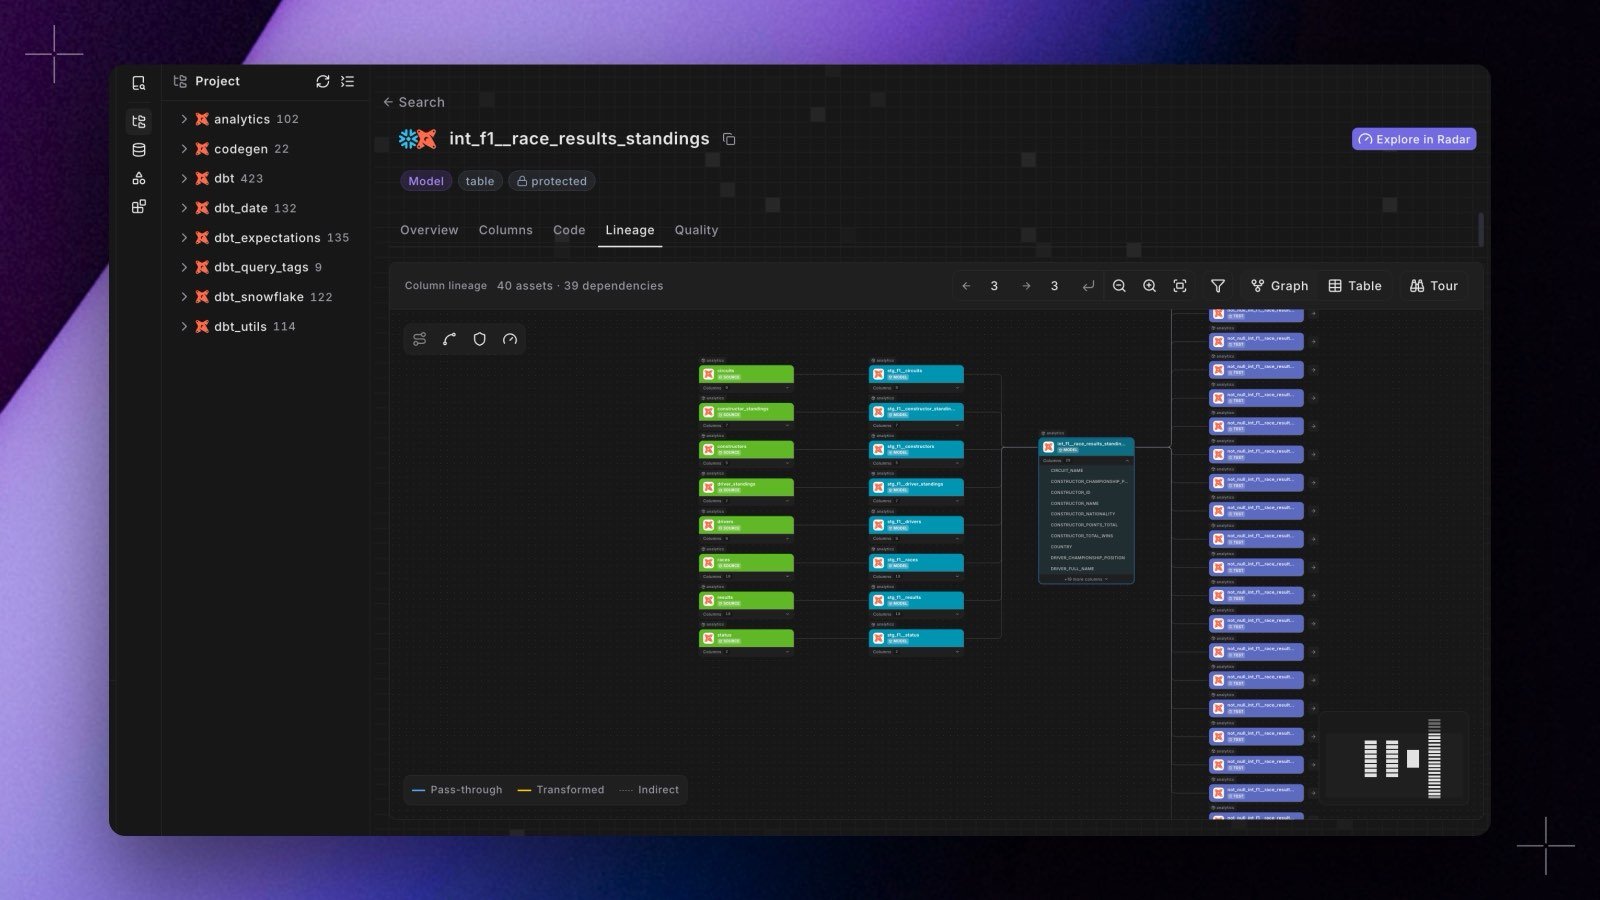
The lineage bar
The bar above the canvas carries everything that shapes the view:- A count of what is on screen, for example
40 assets · 39 dependencies. - Upstream and downstream depth, set independently and applied when you confirm. Lineage opens two levels upstream and two levels downstream.
- Zoom in, zoom out, and fit view, plus a node-type filter. dbt™ tests are hidden by default: open the filter and tick Test to show them, or choose Reset to default to hide them again. The filter never hides the asset you are viewing.
- Graph and Table, which swap between the canvas and the same dependencies as a list.
- Tour, a guided walkthrough of the canvas and its controls.
Two ways to view lineage
Graph view
An interactive DAG of upstream and downstream nodes, with node-type filters, depth controls, and click-through navigation.
List view & export
The same dependencies as a sortable, filterable table you can download as CSV.
Follow a single column
Asset lineage tells you which models feed a model. To trace one value instead, click a column on any card in the Lineage tab, or open a dbt™ asset’s Columns tab and click a column there. Either way, column-level lineage shows where that column’s value comes from, where it flows, and what happened to it at each hop.Sources
At the top of the lineage view, the Sources chips show the source systems feeding the asset (for example a dbt™ source or a Fivetran connector), so you can see at a glance where its data originates.dbt™ Mesh projects
If your workspaces are connected with cross-project dependencies, lineage crosses one workspace boundary in each direction:- In a consumer workspace, each producer model your project references appears as a node tagged with the workspace it comes from. Lineage stops at that model: the producer’s own upstream models, sources, and tests stay in the producer workspace. To trace further, open the model in the producer workspace, if you have access to it.
- In a producer workspace, a model’s downstream lineage includes the models in other workspaces that reference it, tagged with their workspace.
Lineage is built from your dbt™ project and connected integrations, and populates after your first Bolt production run. If an asset isn’t part of the graph yet, the view shows a note instead of a diagram.