

Open it
There are two ways in, and both draw the same canvas:- From the Lineage tab. Open any dbt™ model, source, seed, or snapshot in the catalog and select its Lineage tab, then click a column on any card to trace it in place.
- From the Columns tab. Click a column there and a drawer opens from the bottom of the screen with the lineage graph for that column.
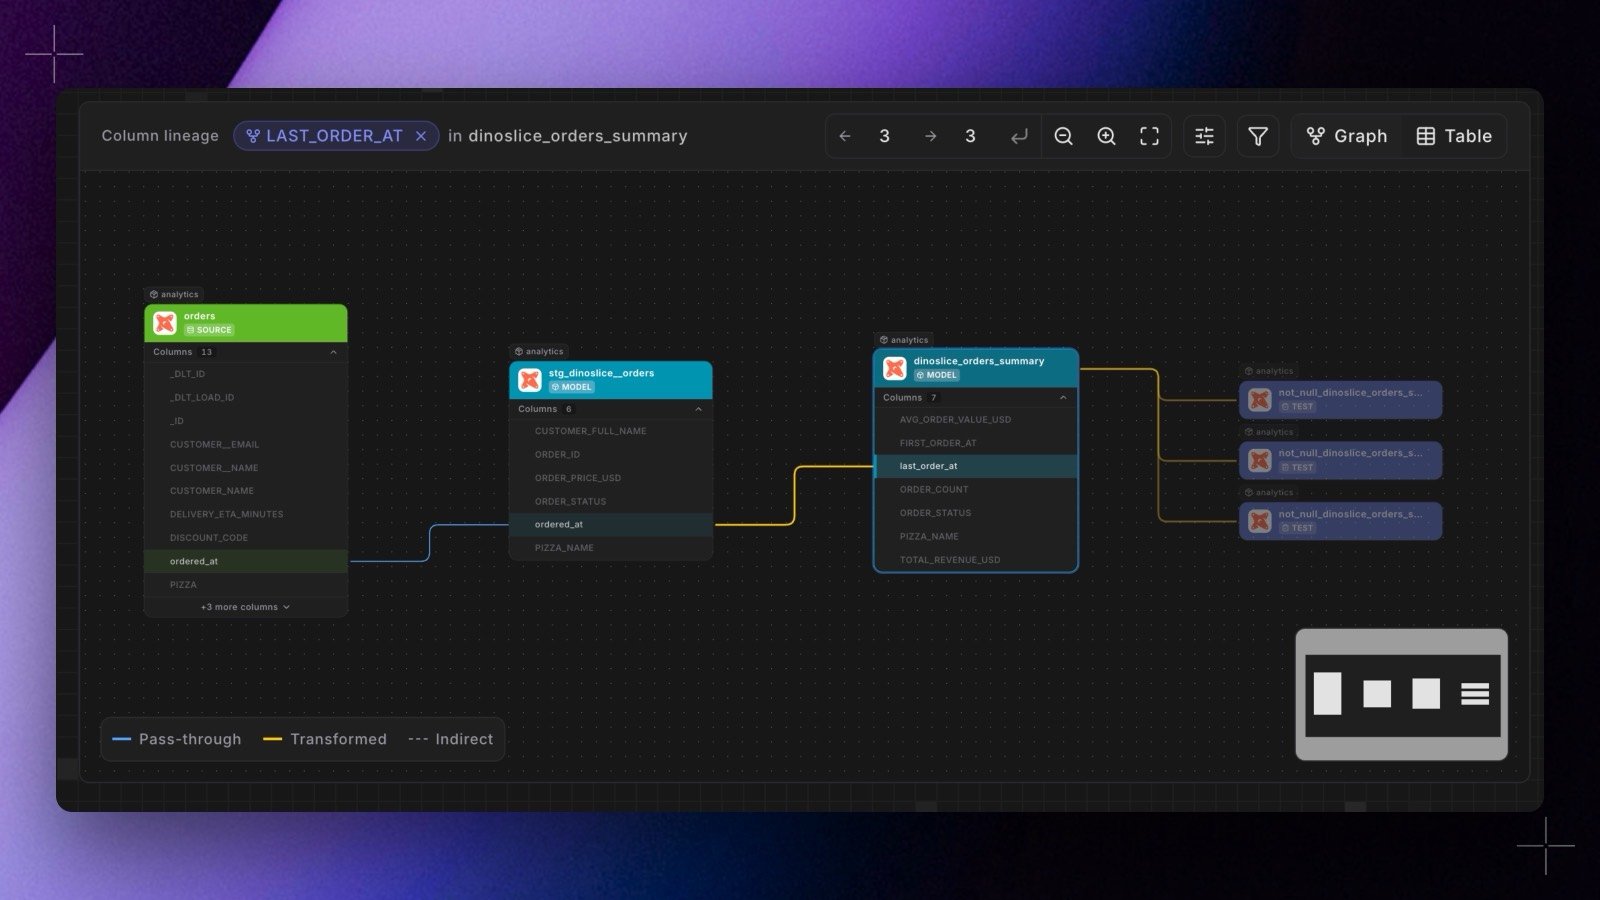
Column-level lineage is built for dbt™ assets from your compiled SQL. It appears once a
dbt docs generate has run for the model, the same production run that populates the rest of the catalog. Assets from BI and ingestion tools connect at the table level, in the graph view.Read the graph
The graph flows left to right: upstream sources on the left, downstream consumers on the right.- Each card is a model or source, titled with its name and package, and the columns involved in this lineage are listed as rows inside it.
- The column you opened is highlighted, and every card on its value path stays bright. Cards that are only in the graph for context are dimmed.
- Edges join column to column across cards. An edge that lands on a card’s header rather than on a row means the column affects that whole dataset rather than one of its columns.
What the edges mean
The legend in the corner of the canvas names the three kinds of edge. Hover any edge to see its exact label.Parse status
Each card carries the parse status of its model, because column lineage is only as good as the SQL Paradime could read:- Parsed: the model’s compiled SQL resolved completely.
- Partial: some columns could not be resolved, typically a
SELECT *with no column schema available. The edges that did resolve are still shown. Quoted column names, such as mixed-case names or names with special characters, resolve with their exact warehouse spelling, so they do not make a model Partial. A model that was marked Partial for this reason is re-parsed on its next catalog build, with nothing for you to do. - Failed: the model could not be parsed. It stays in the graph with table-level edges instead of disappearing.
EXCEPT, STRUCT, UNNEST, and so on) resolves correctly. Results are cached per model, so a rebuild only re-parses what changed.
Control what’s shown
Depth
Two fields in the toolbar set how far the graph reaches upstream (←) and downstream (→), independently, starting at two hops each way. Enter a number of hops, or+ for everything, then press Enter or click the apply button. Both directions apply together, and nothing refetches until you apply, so a half-typed number never redraws the graph.
Tracing a reporting column back to its sources wants deep upstream; assessing the blast radius of a change wants deep downstream.
Lenses
The lens strip on the canvas filters the graph on what each edge actually is. Each lens is an icon, filled in when it is applied, with its name and description on hover. Apply several at once. Your selection is remembered between sessions, so a lens you rely on is still applied when you come back.- Only this column’s path: strip the graph to the cards the traced value actually flows through. Everything the column does not touch leaves the canvas, and the graph refits around what is left. The walk follows column-to-column edges, so an edge that ends at a dataset does not drag unrelated models onto the path. A trace with no column-grain edges at all still walks at dataset grain.
- Hide indirect edges: strip the graph down to pure value flow, dropping joins, filters, and grouping.
- Masked columns only: keep only edges where the value passes through a masking transformation, for tracing sensitive fields.
- Hide low-confidence edges: drop the edges Paradime was least sure about, which mostly come from partially parsed models.
Canvas
Zoom in and out, or fit view to bring the whole graph back into frame. Opened as a drawer, it starts at a comfortable height and can be expanded to nearly full screen for a deep graph.Take the tour
Click Tour in the lineage bar for a guided walkthrough of the canvas: the depth controls, the lens strip, the legend, the minimap, and the Graph and Table views. The same tour is available from the Lineage tab in the Code IDE, minus the steps for controls that panel does not have.Move around
- Click any column on any card to refocus the graph on that column, in place, without leaving the drawer.
- Click a card’s model name to open that model’s catalog page.
When the graph is empty
A column with no lineage shows No column lineage available. The usual reasons are that the model has not been through adbt docs generate yet, or that its SQL could not be parsed, in which case the message names what got in the way.
DinoAI can trace the same lineage in chat and over MCP, which is useful for impact analysis across many columns at once. See the Column Level Lineage tool. To see column impact on every pull request instead, set up lineage diff.