

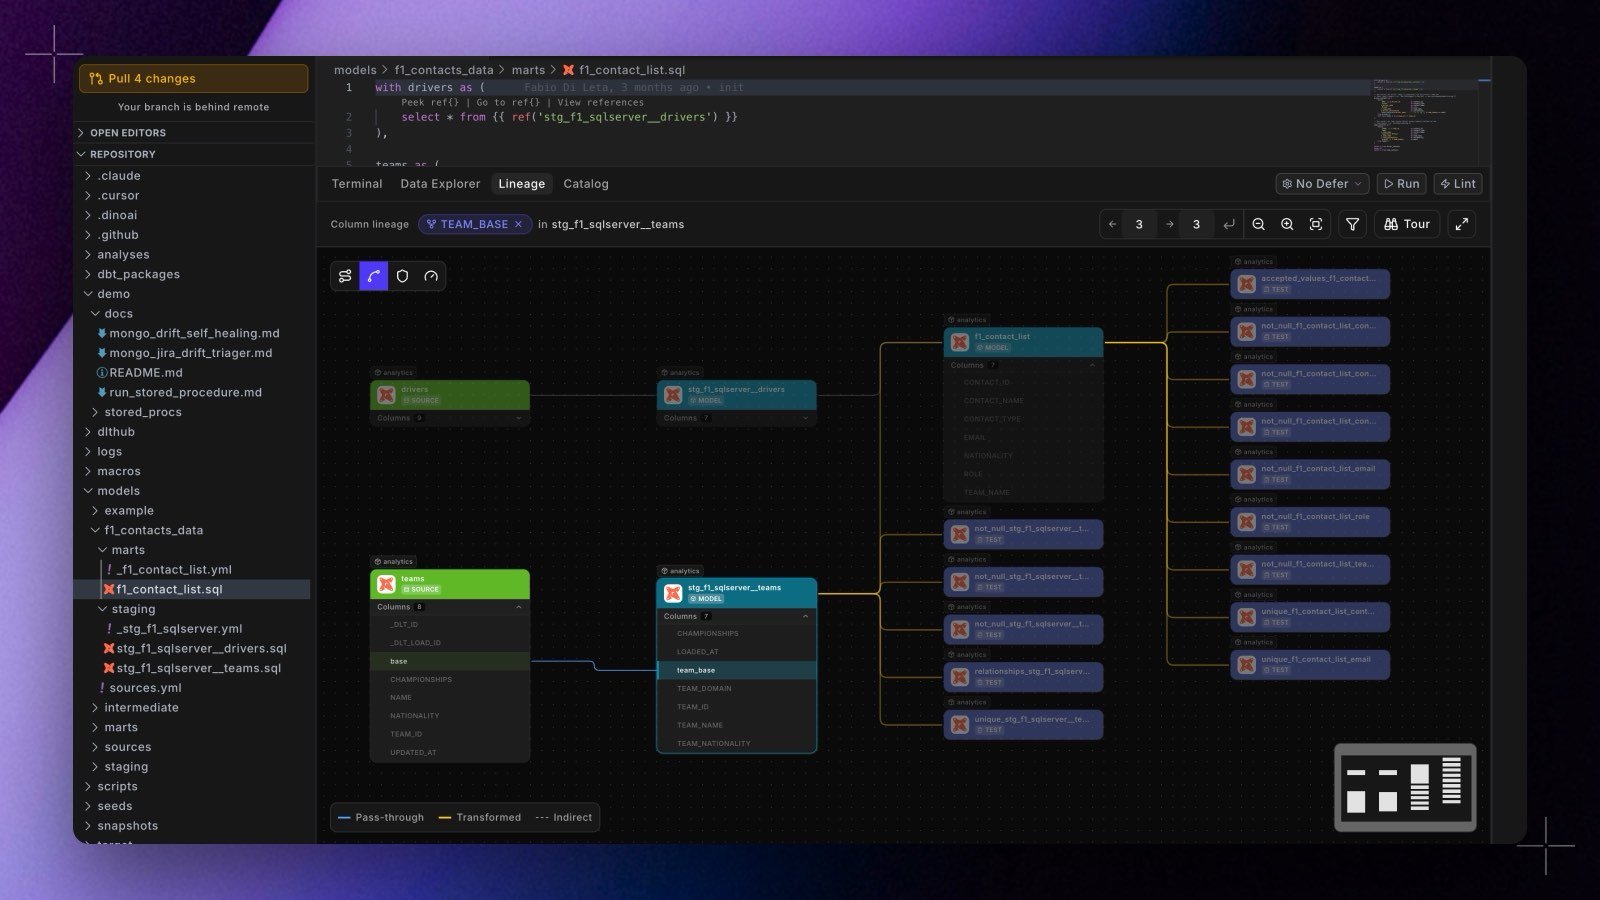
Open it
- Open any dbt™ model in the editor.
- Click the Lineage tab in the bottom panel.
- Use the full-screen button in the bar for a deep graph, and collapse it again when you’re done.
Trace a column
Click any column on any card to trace that value: where it comes from, and where it flows. The trace runs against your development catalog, so it reflects the branch you are working on rather than production. The bar names what you are tracing, for example Column lineage TEAM_BASE in stg_f1_sqlserver__teams. Clear the chip to go back to the model’s own lineage. Click a card’s model name to open that model’s file in the editor. Cards carry their schema, their type (MODEL, SOURCE, TEST), and a count of the columns involved, which you can collapse to tighten a dense graph. Test cards stay hidden until you show them with the node-type filter. For what the cards, edges, and parse statuses mean, see Column-level lineage. The reading is identical here.Controls
The bar on the right of the Lineage tab carries:- Upstream and downstream depth, set independently, applied when you confirm rather than on every keystroke. The panel opens two levels upstream and two levels downstream.
- Zoom in, zoom out, and fit view.
- A node-type filter, to drop kinds of node you don’t want on the canvas. dbt™ tests are hidden by default: tick Test to show them, or choose Reset to default to hide them again.
- Tour and full screen.
Lenses
The lens strip on the canvas filters the graph by what each edge actually is. Each lens is an icon, filled when it is applied, with its name and description on hover. Your selection is remembered between sessions.- Only this column’s path: strip the graph to the cards the traced value actually flows through. Everything it does not touch leaves the canvas, and the graph refits.
- Hide indirect edges: drop joins, filters, and grouping, leaving pure value flow.
- Masked columns only: keep only edges where the value passes through a masking transformation.
- Hide low-confidence edges: drop the edges Paradime was least sure about, which mostly come from partially parsed models.
Take the tour
Click Tour in the lineage bar for a guided walkthrough of the canvas and its controls. It is the same tour the Catalog offers, minus the steps for controls this panel does not have.The lineage updates automatically when:
- you edit dependencies and commit your changes.
- Change the .sql file currently open in your editor.