

Logs
Radar → Snowflake → Logs pairs a daily spend strip with the individual queries behind it.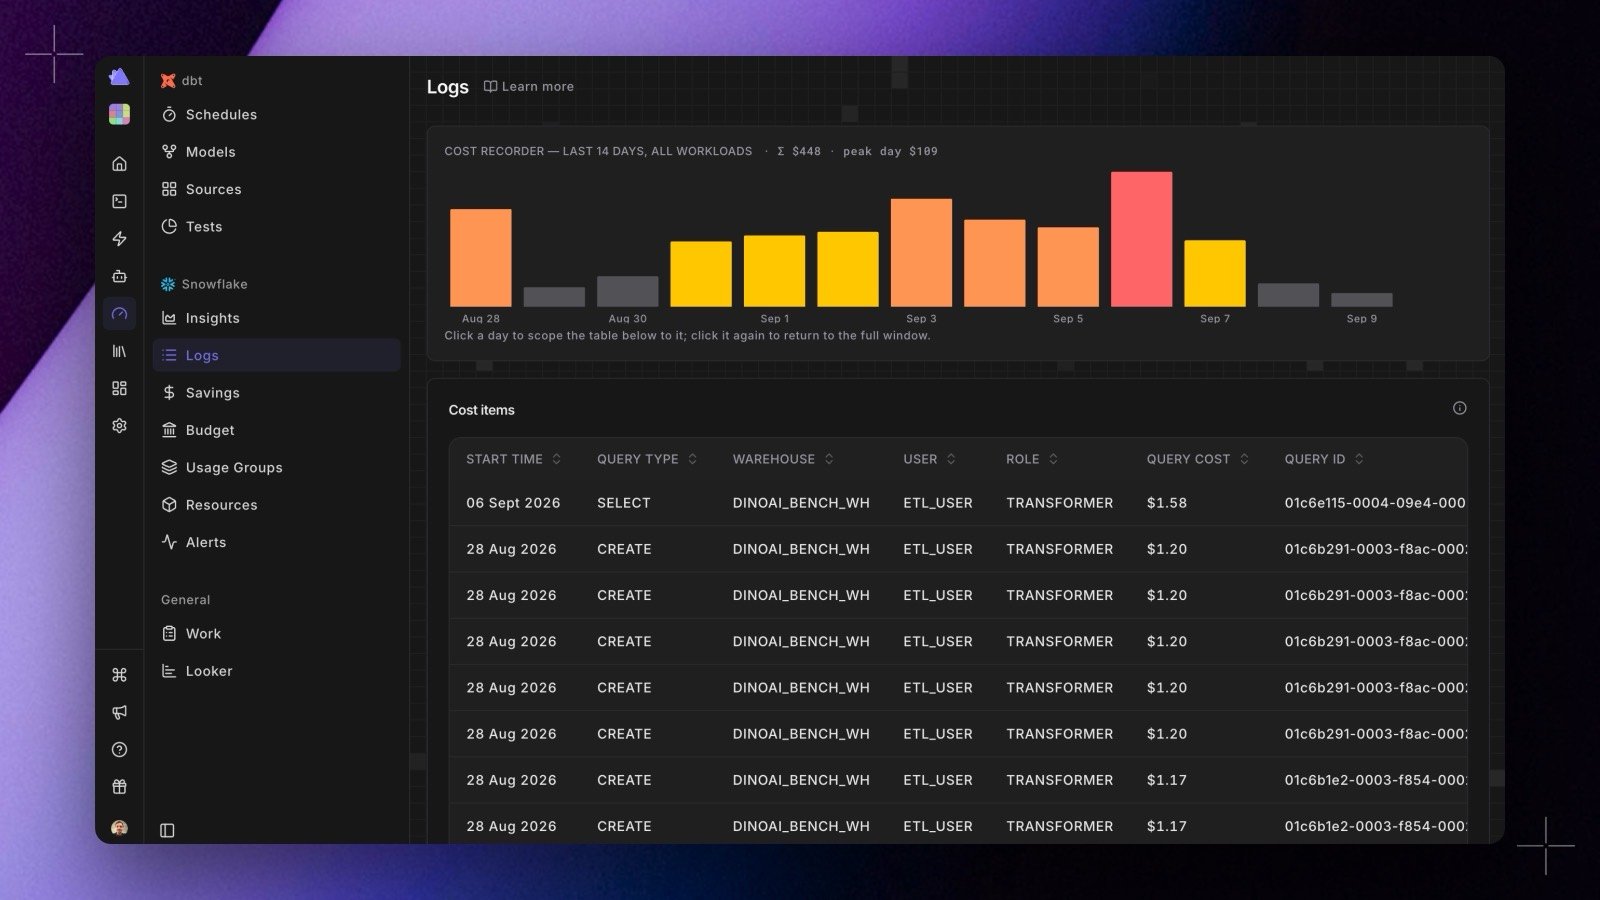
- The cost recorder shows one bar per day across the recent window, covering every workload that hit the warehouse: dbt™, BI, ad-hoc, and service queries alike. Bars are coloured by how heavy the day was, so spikes stand out next to the long tail, and the header carries the window, the total, and the peak day.
- The Cost items table lists the individual queries: start time, query type, warehouse, user, role, query cost, and query id. Every column sorts, and the most expensive queries come first.
Resources
Radar → Snowflake → Resources is an inventory of the warehouses Radar has seen in your cost data, filterable by name. Each shows its spend over the last 90 days, how many days it was active, and when it was first and last seen.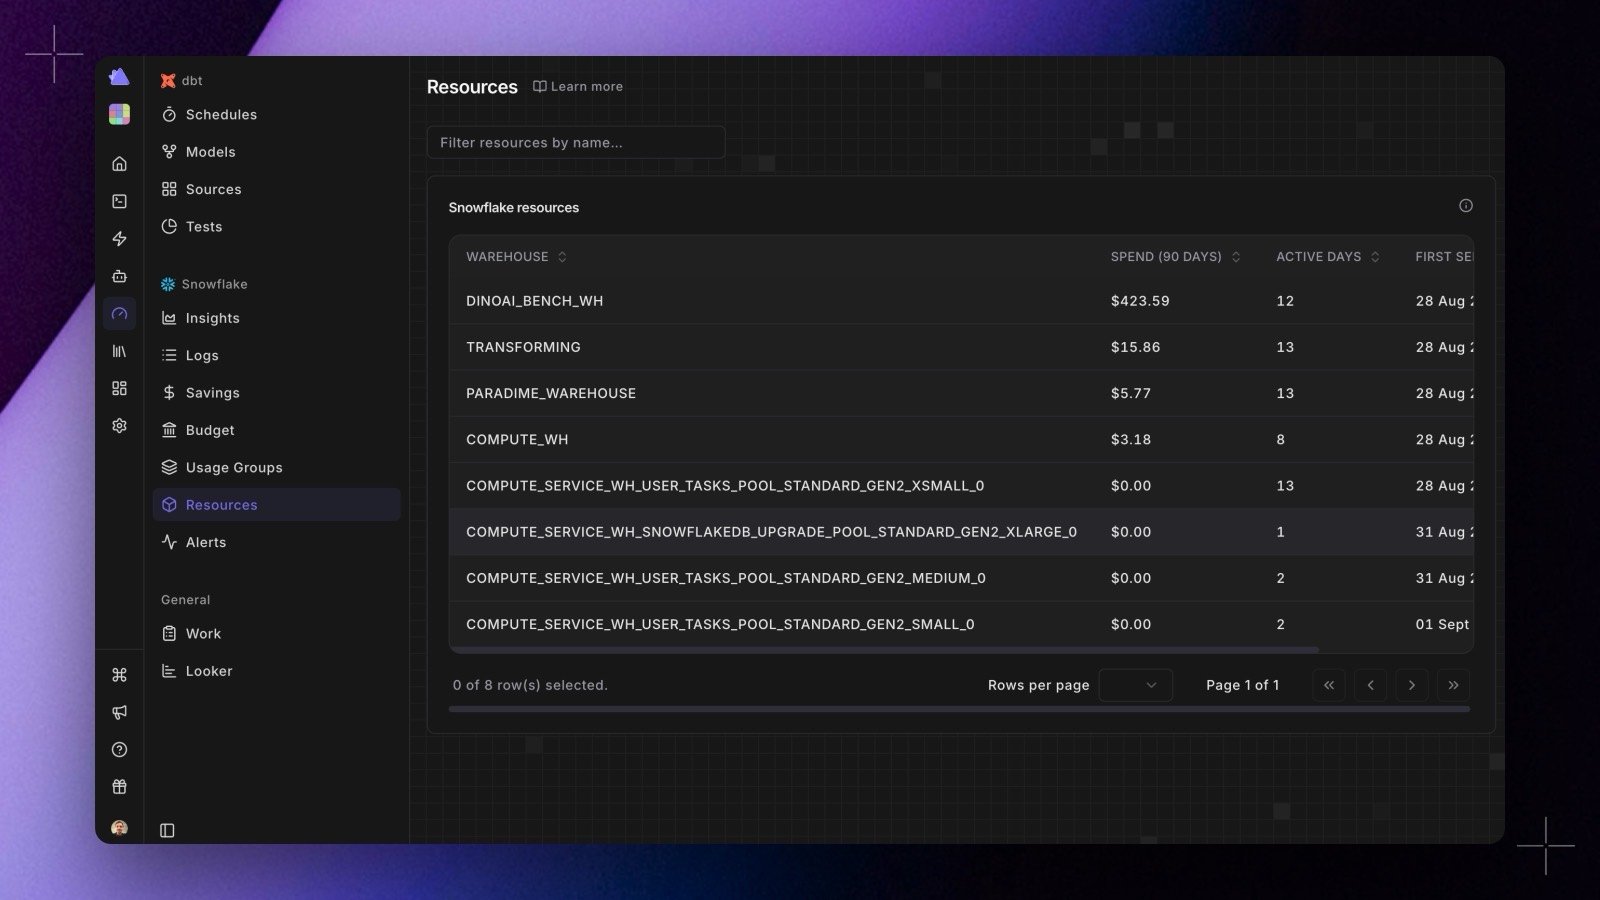
Logs and Resources read Snowflake cost data. On BigQuery cost workspaces these views are empty; use BigQuery Cost Monitoring instead.