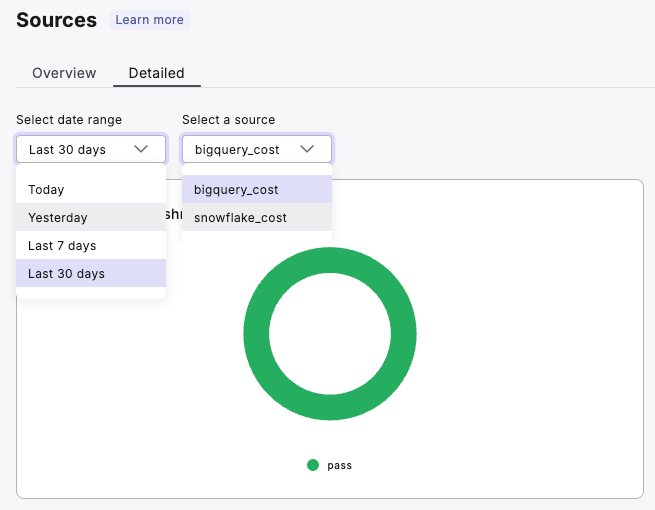
The Sources dashboard is divided into two main sections:
- Overview: Provides a high-level summary of all data sources. [link]
- Detailed: Offers in-depth analytics for individual sources. [link]
Overview Section
The Overview section gives you a broad perspective on your data sources’ health and freshness, allowing you to uncover key insights, including:1. Source Freshness Overview
Value: Quickly assess the freshness status of your source tables.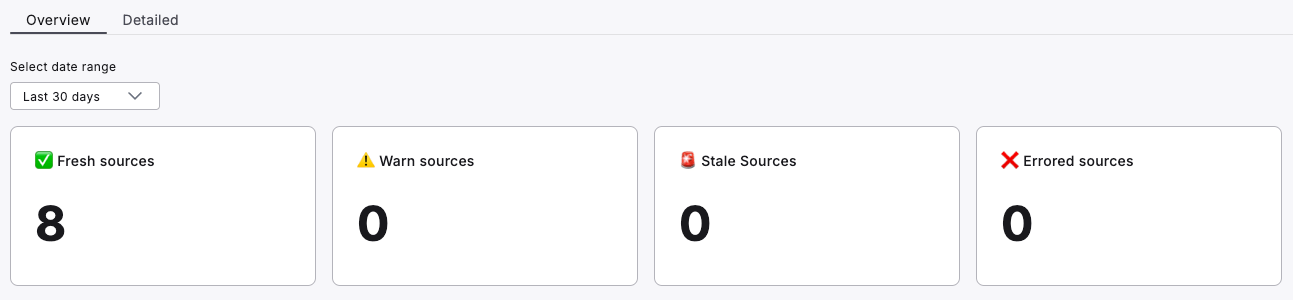
How to use:
- Monitor the number of sources in each freshness category (Fresh, Warn, Stale, Errored).
- Identify potential issues by focusing on non-fresh sources.
- Track these metrics over time to ensure overall data freshness is maintaining or improving.
2. Current Source Tables Status Details
Value: View detailed information about the current freshness status of source tables.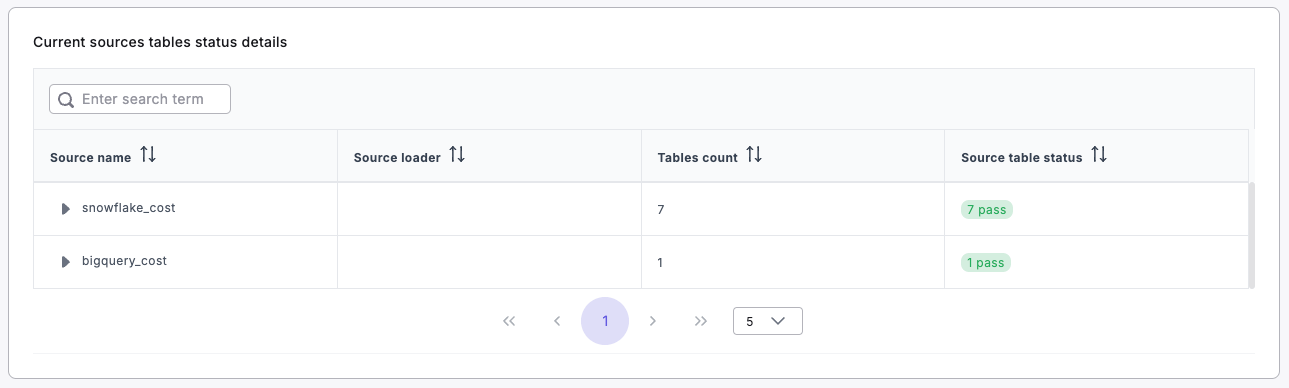
How to use:
- Click dropdowns to review individual sources.
- Identify which sources or tables may need attention based on their status.
- Use the search functionality to quickly find specific sources or tables.
3. Source Health Monitoring
Value: Monitor the overall health of your data sources over time.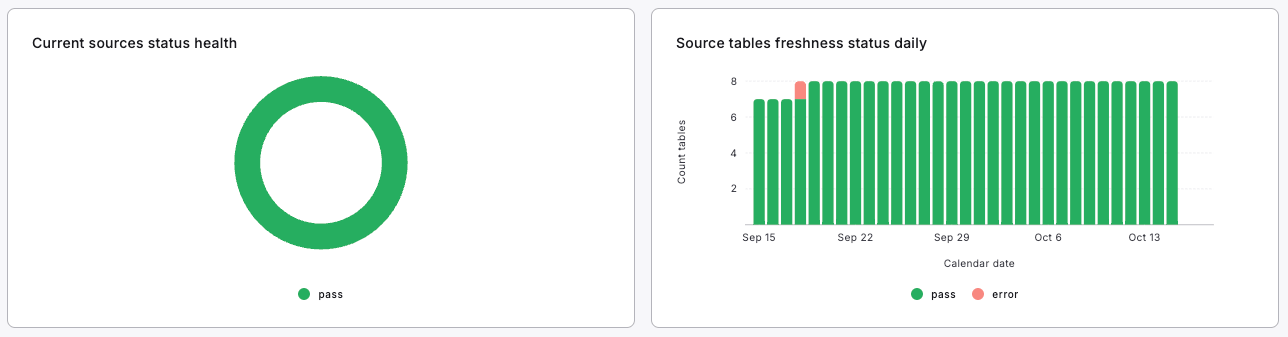
How to use:
- Observe the overall health trend of your sources.
- Identify any patterns or recurring issues in source freshness.
- Use this information to prioritize source maintenance and optimization efforts.
Detailed Section
The Detailed section allows you to dive deep into individual source performance, providing comprehensive insights such as:1. Individual Source Freshness Status
Value: Get a detailed view of freshness status for a specific source.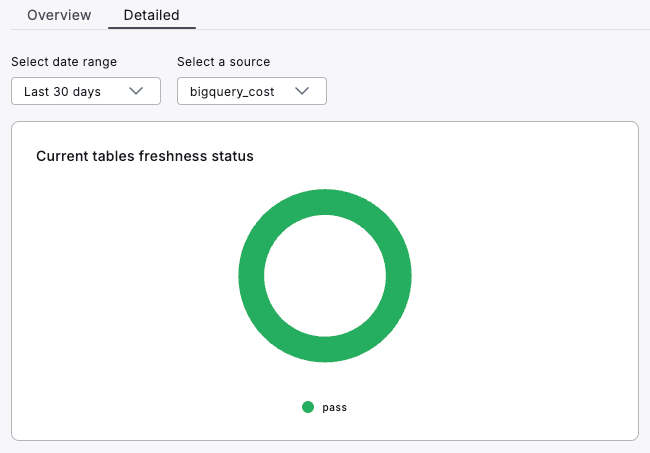
How to use:
- Select a specific source to analyze its current freshness status.
- Use this information to quickly assess the health of critical data sources.
2. Data Source Freshness Details
Value: Analyze detailed freshness information for each table within a source.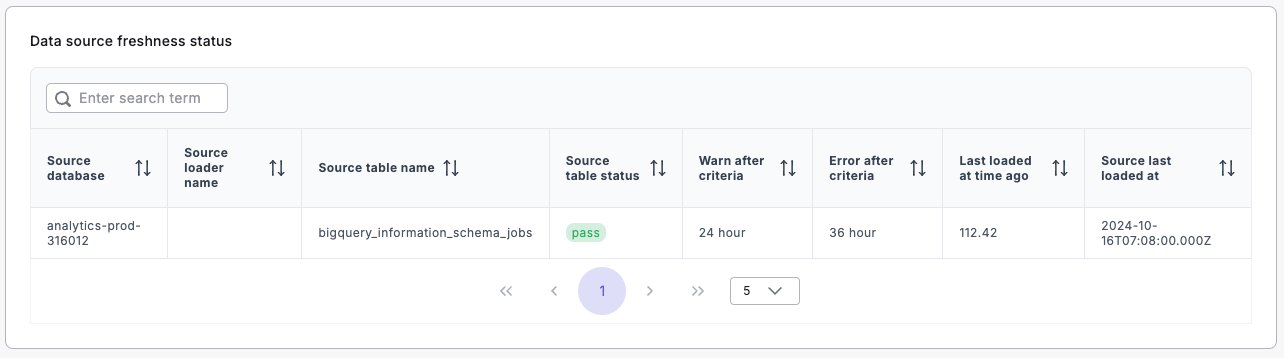
How to use:
- Review freshness criteria, status, and last loaded times for each table.
- Identify tables that may be approaching warning or error thresholds.
- Use this information for proactive maintenance of your data sources.
3. Freshness Trends Analysis
Value: Understand how source freshness evolves over time.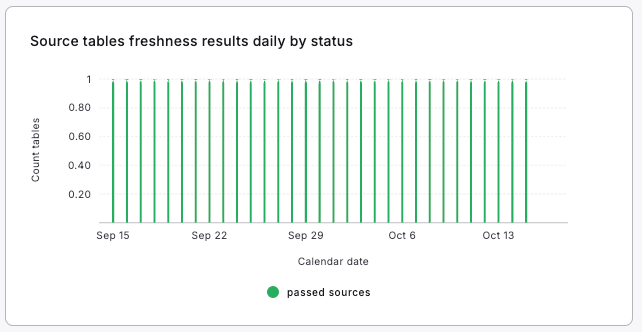
How to use:
- Observe trends in the number of passed and errored sources over time.
- Identify any recurring patterns or improvements in source freshness.
- Use these insights to assess the impact of any optimization efforts.
How to Apply Filters
- Locate the “Select date range” dropdown at the top of both Overview and Detailed sections.
- In the Detailed section, use the “Select a source” dropdown to focus on a specific data source.
- The dashboard will automatically update to reflect your selections, allowing for focused analysis over your chosen time period and source.