- Overview: Provides a high-level summary of all models. [link]
- Detailed: Offers in-depth analytics for individual models. [link]
Overview Section
The Overview section gives you a broad perspective on your dbt™ models’ performance, allowing you to uncover key insights, including:1. Execution Efficiency and Reliability
Value: Quickly identify time-intensive models and assess overall reliability to find efficiency gains.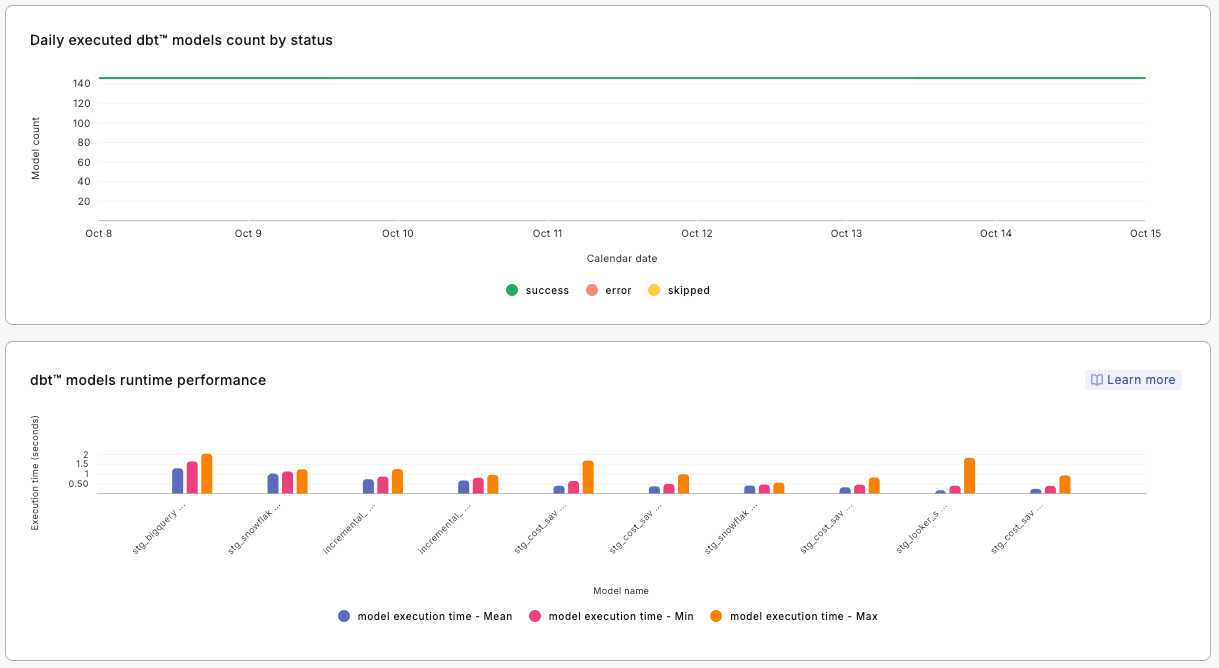
How to use:
- Monitor the daily success, error, and skipped rates of your dbt™ model runs.
- Investigate models with consistently long execution times for optimization opportunities.
- Identify patterns in model execution failures to improve overall reliability.
2. Materialization Strategy Analysis
Value: Understand the distribution of materialization types across your models to optimize resource usage and reduce costs.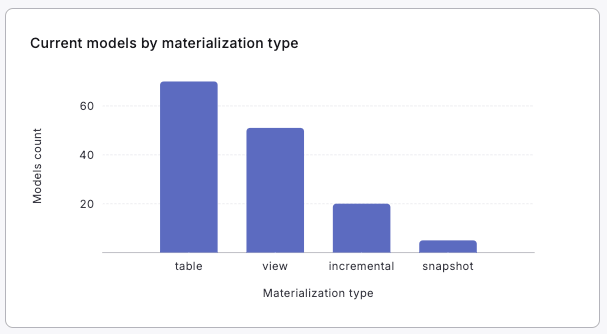
How to use:
- Review the distribution of materialization types (table, view, incremental, snapshot).
- Identify opportunities to optimize materialization strategies for better performance and cost-efficiency.
- Consider adjusting materialization types for models based on their usage patterns and update frequency.
3. Model Failure Analysis
Value: Pinpoint models that fail frequently to bolster reliability.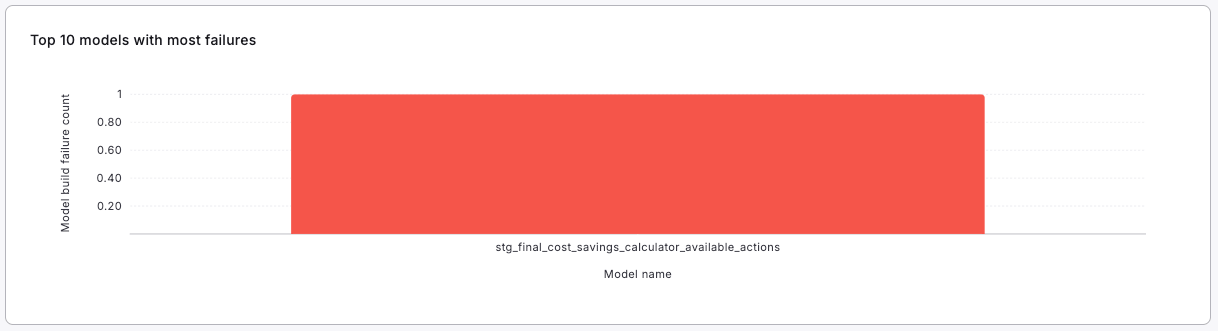
How to use:
- Focus on models with the highest failure counts for immediate troubleshooting.
- Investigate common causes of failures across problematic models.
- Implement error handling and notification systems for critical models.
4. Schedule Dependency Insights
Value: Understand how models are utilized across different schedules.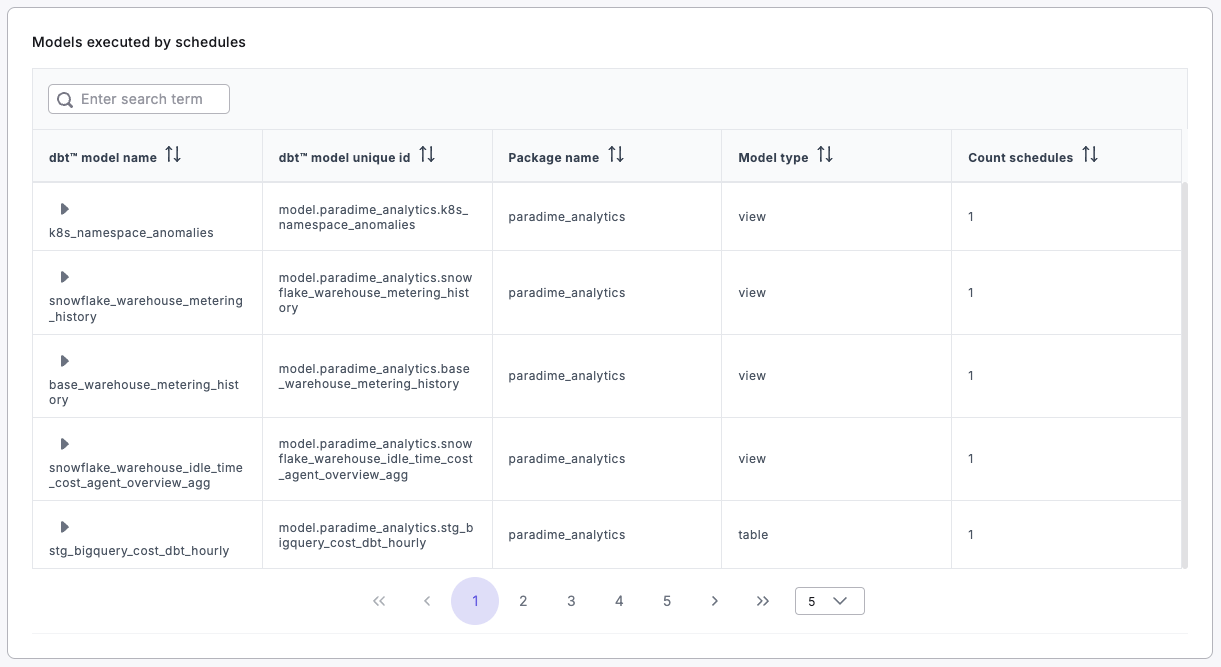
How to use:
- Identify models that are used in multiple schedules, indicating their importance in the data pipeline.
- Ensure critical models have appropriate testing and monitoring in place.
- Optimize schedules based on model dependencies and execution patterns.
Detailed Section
The Detailed section allows you to dive deep into individual model performance, providing comprehensive insights such as:1. Model Reliability and Performance
Value: Analyze the consistency, reliability, and performance of individual models.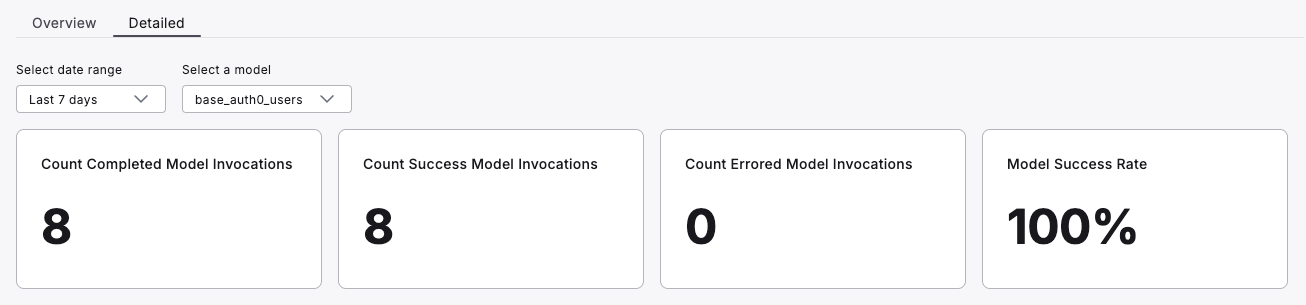
How to use:
- Monitor the overall success rate and invocation counts to gauge model reliability.
- Track the duration of each run over time to identify performance trends.
- Investigate any patterns in errors or unusually long run times.
- Use these metrics to prioritize which models need optimization or troubleshooting.
2. Execution Time Analysis
Value: Understand execution patterns and identify potential bottlenecks.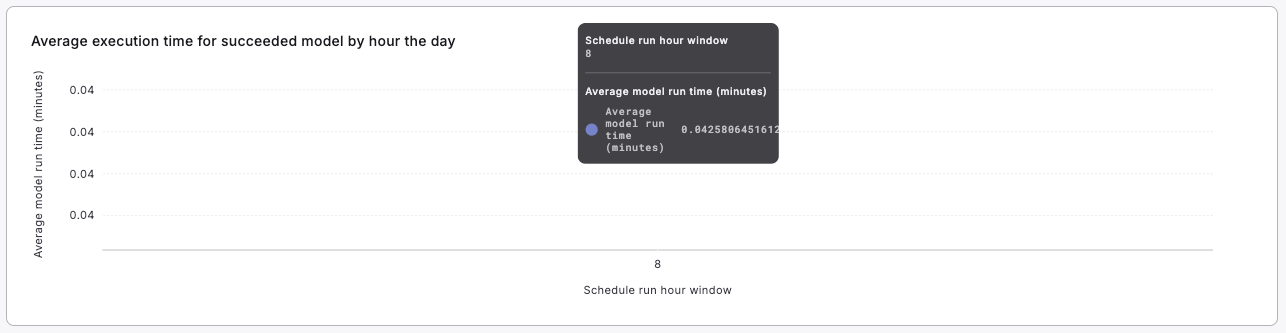
How to use:
- Identify peak execution times for the model throughout the day.
- Consider adjusting run schedules to optimize resource utilization.
- Investigate factors contributing to longer execution times during specific hours.
3. Model Invocation Trends
Value: Gain insights into the frequency and success of model executions over time.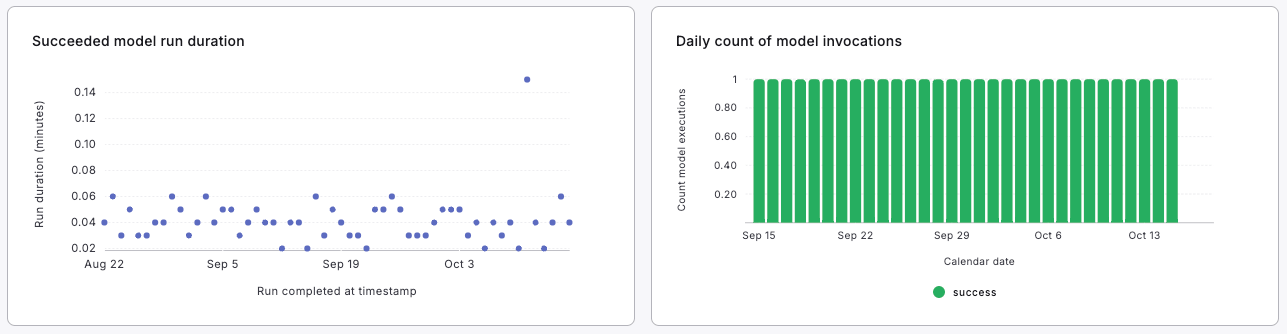
How to use:
- Observe trends in model invocation frequency.
- Correlate invocation patterns with business activities or data refresh schedules.
- Identify any unexpected spikes or drops in model usage.
4. Schedule Execution Details
Value: Get a comprehensive view of how the model is executed within different schedules.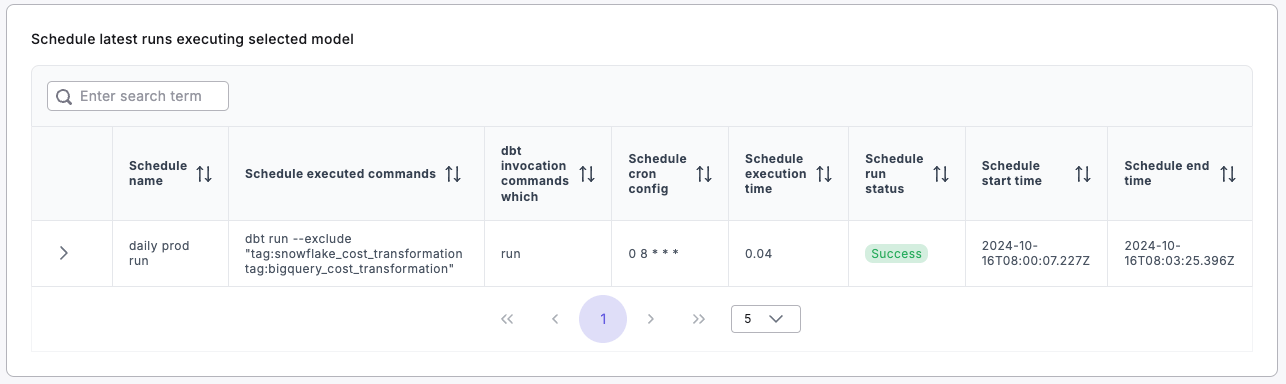
How to use:
- Review the specific commands and configurations used to execute the model in different schedules.
- Analyze execution times across different schedules to identify potential optimizations.
- Ensure consistent performance across all schedules that use the model.
How to Apply Filters
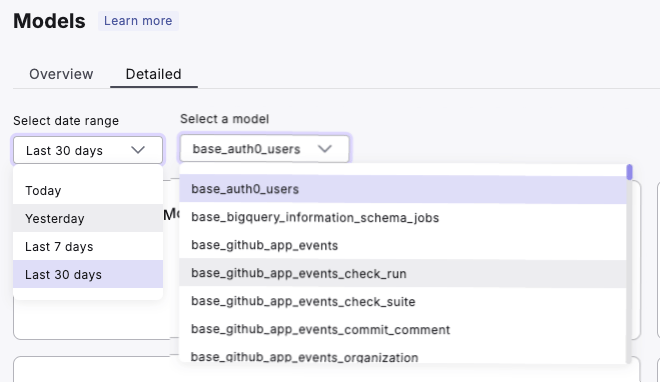
- Locate the “Select date range” and “Select a model” dropdown at the top of the dashboard.
- Choose your desired date range and specific model for analysis.
- The dashboard will automatically update to reflect your selections, allowing for focused analysis of specific models over your chosen time period.