

Dashboards
Snowflake Cost Optimizations
Automatically optimize Snowflake resources with AI-driven analysis to reduce costs and enhance efficiency, all while maintaining performance.
Snowflake Cost Monitoring
Track Snowflake usage and costs with detailed dashboards covering warehouse spending and dbt™ operations.
BigQuery Cost Monitoring
Monitor BigQuery expenses with insights into query costs, user activity, and slot utilization to identify savings.
Budgets
Set monthly Snowflake budgets per warehouse or for the account, track them against actuals, and alert on the thresholds you choose.
Usage groups
Roll warehouses up into the teams, environments, or workloads you budget by, and budget at the group level.
Logs & Resources
Explore raw per-query cost over the last 90 days, and inventory the warehouses seen in your cost data.
Ingestion
Check when Radar last read each cost connection, and retry a failed ingestion.
Several Snowflake accounts
When a workspace has two or more Snowflake cost connections, the Radar cost pages show an account selector at the right end of the page header. Choose All accounts to see every account together, or choose one account. Each account shows as its connection name and account. Your choice is kept in the page URL, so a link you share opens on the same account. To add an account, see Connect several accounts or projects.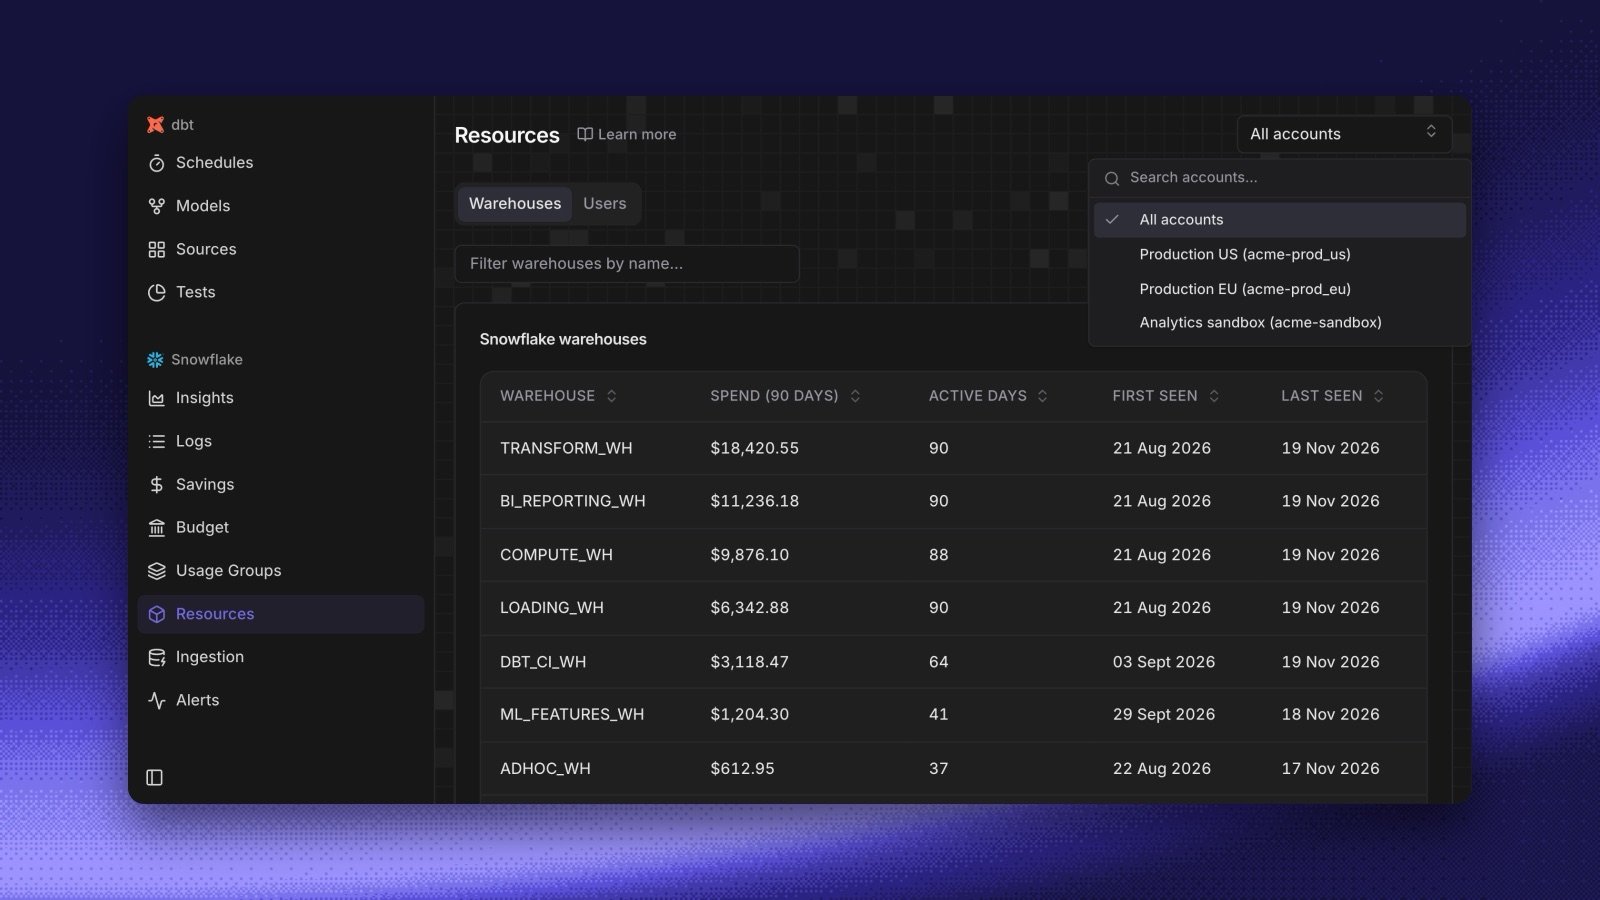
Ingestion always lists every connection, so it has no selector. A Snowflake alert watches the account you choose when you create it. See Choose the account an alert watches.
On BigQuery, Radar shows the spend of all your cost connections together, with no selector.
New to Radar?Get up and running quickly with our Get Started guide.