

Need to connect New Relic first? Follow our New Relic integration setup guide to authenticate and connect your account.
Configure New Relic Trigger
Step 1: Add New Relic Destination
- Navigate to the Triggers integration section
- Click Add Integration
- Select New Relic from the dropdown
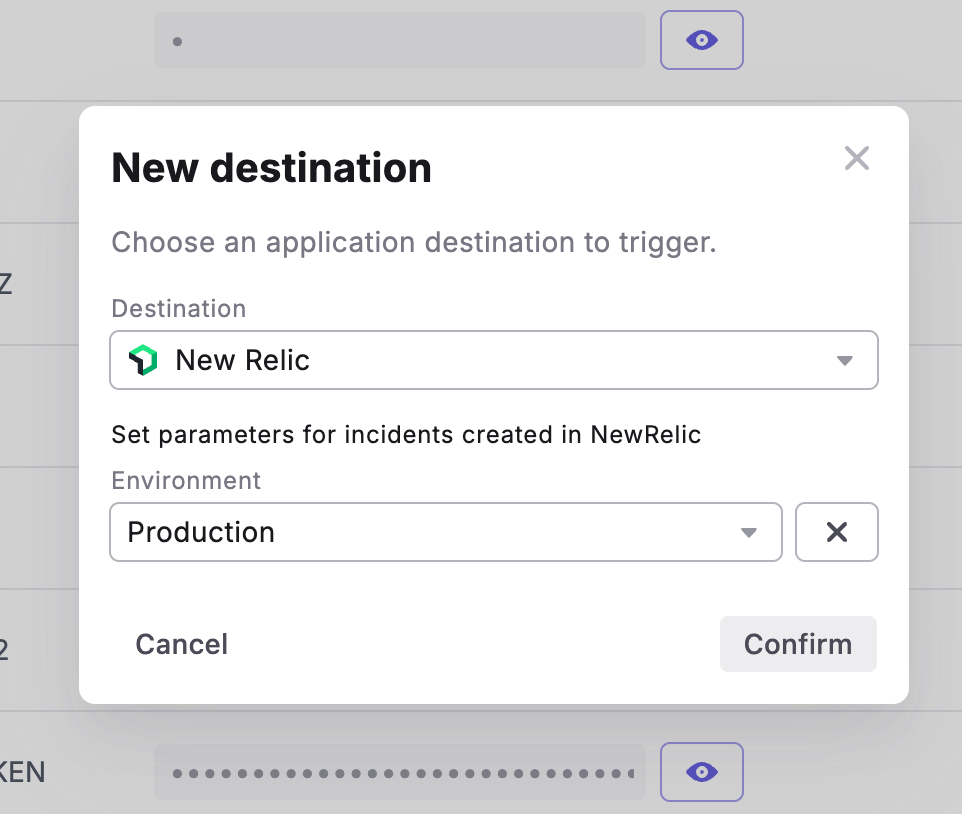
Step 2: Set Incident Parameters
Configure the following field to customize incidents created in New Relic:Step 3: Confirm Configuration
- Review your incident parameters
- Click Confirm to save the trigger
- The New Relic trigger is now active for this schedule
What Gets Created
When a Bolt run fails, New Relic will automatically create an incident containing:- Incident title with schedule name and workspace
- Incident details including:
- Direct link to Paradime run logs
- Run ID with direct link
- Execution timestamps
- Commands executed
- Branch information
- AI Summary of the command logs
- Configured environment classification
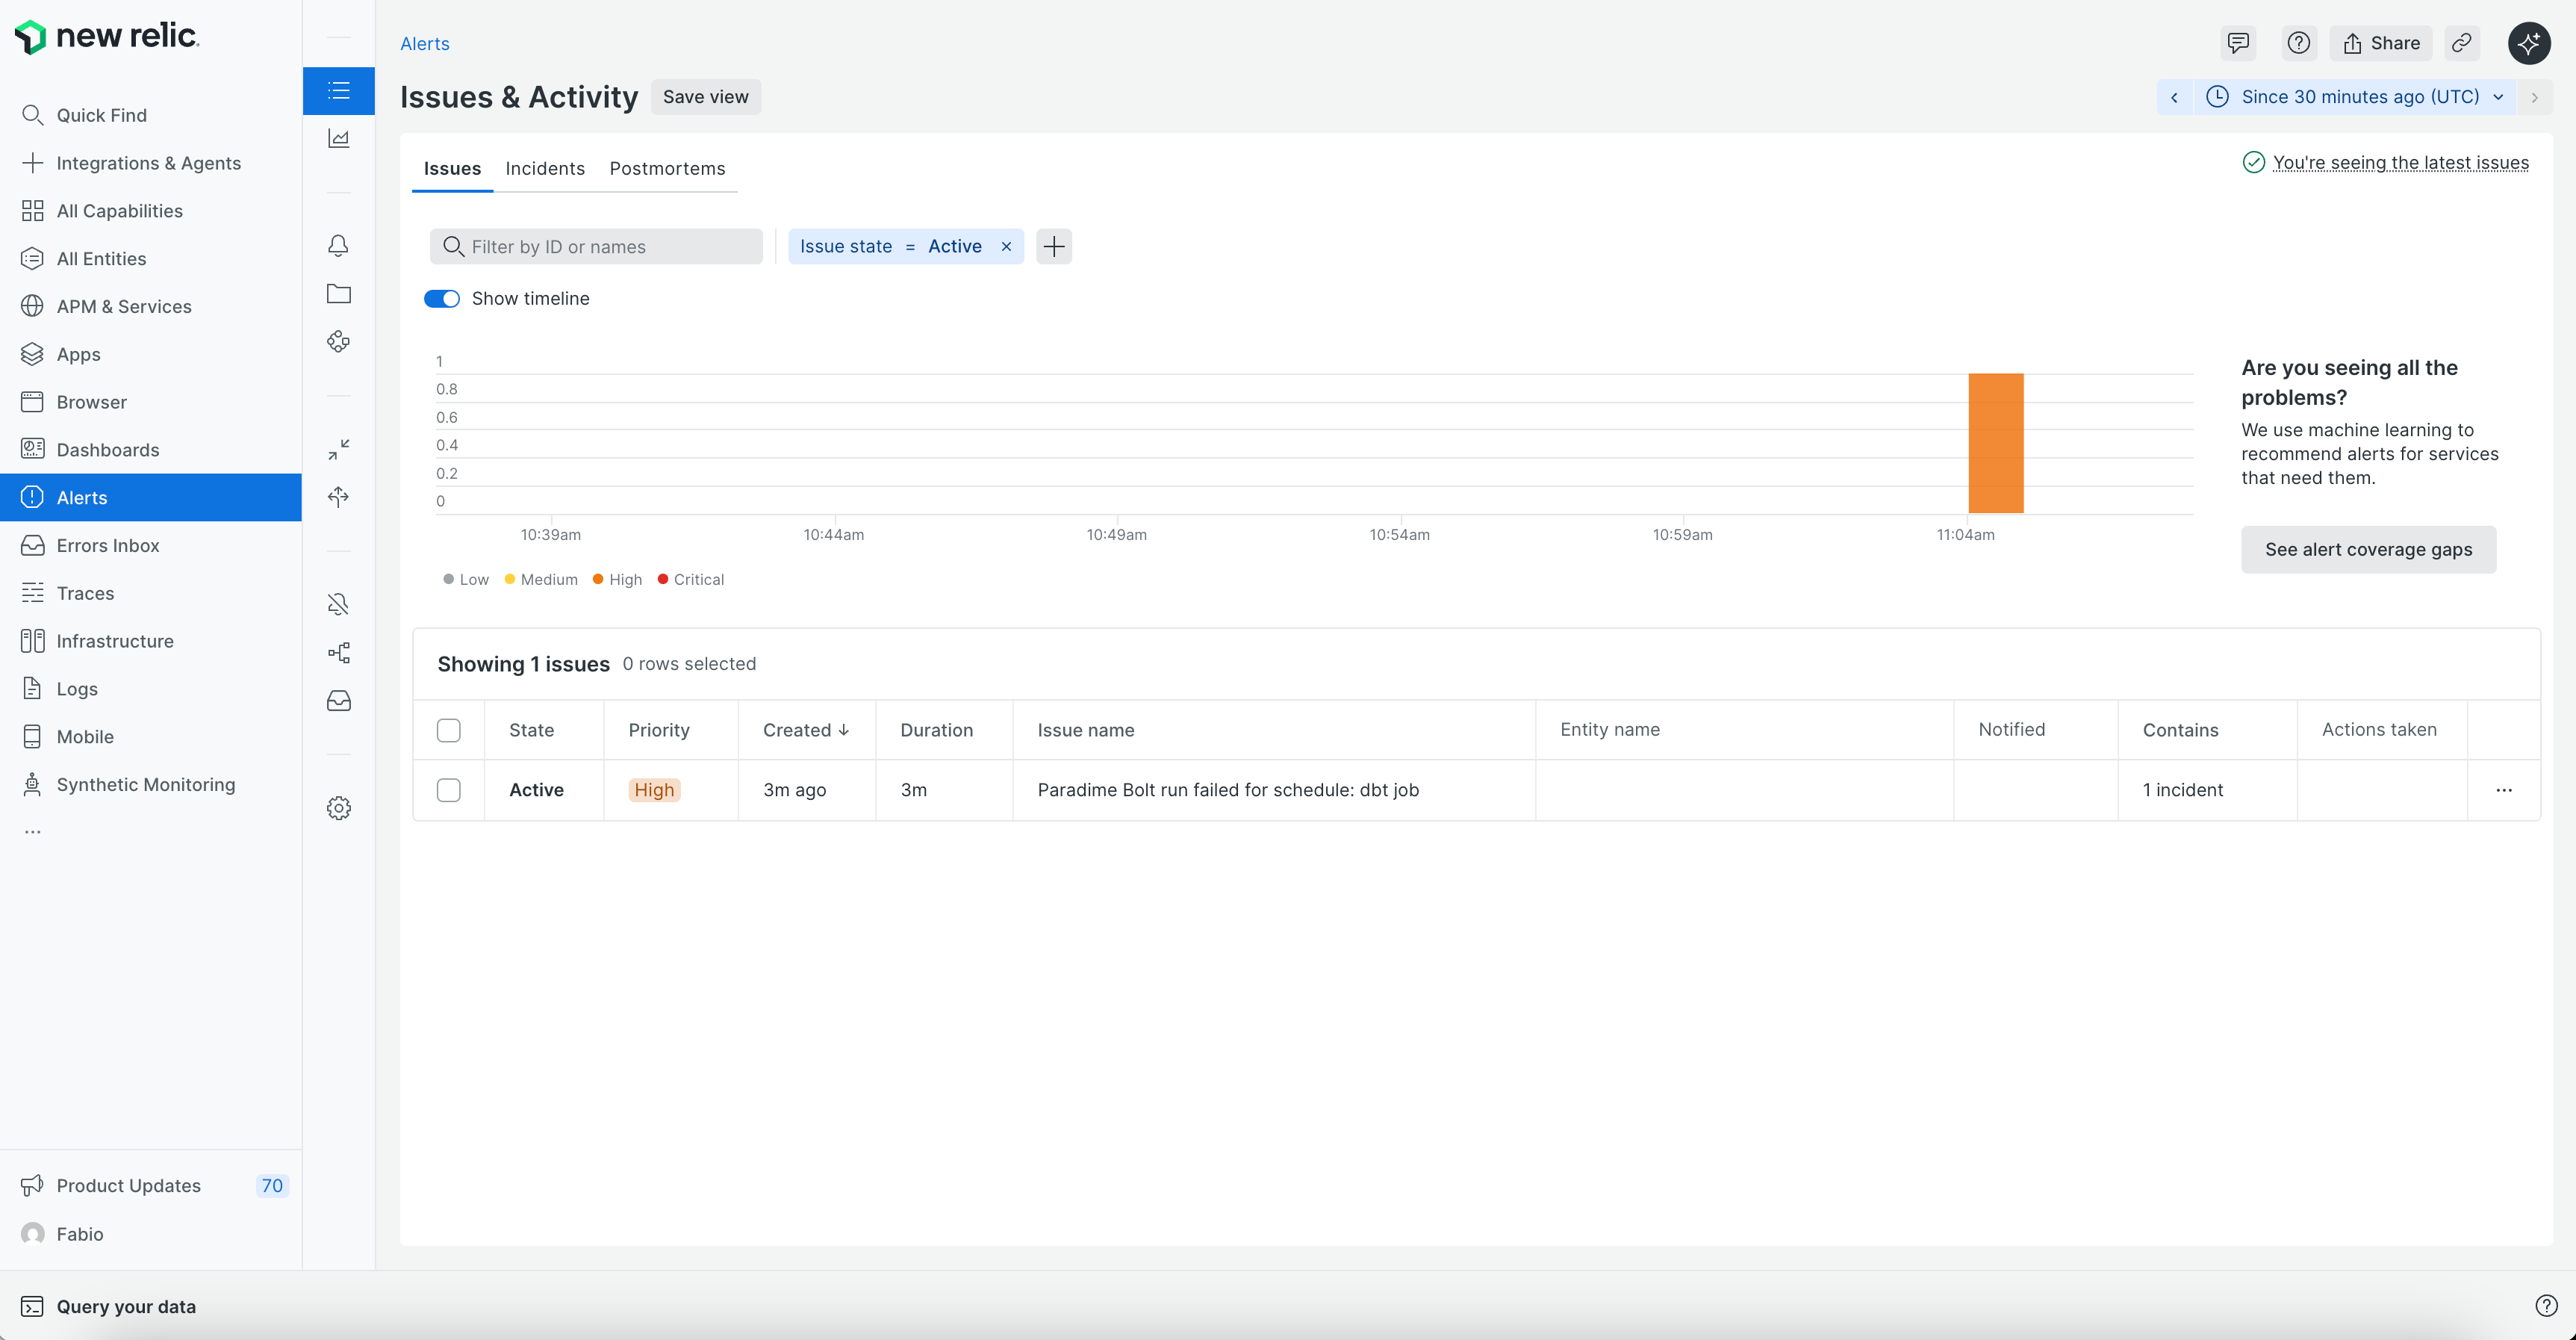
Testing Your Configuration
- Manually run a schedule that will fail
- Check your New Relic dashboard for the new incident
- Verify the incident contains the correct parameters and run details
- Confirm the incident appears in the correct environment
Key Benefits
- Centralized observability - Track pipeline failures alongside application and infrastructure monitoring
- Unified dashboards - Monitor data pipeline health with your existing New Relic setup
- Cross-team visibility - Share pipeline incidents with platform and DevOps teams
- Faster debugging - Jump directly from New Relic alerts to Paradime run logs