New Relic is a monitoring and observability platform. Connecting New Relic to Paradime automatically creates incidents in New Relic whenever a Bolt schedule fails, so your team can track and resolve dbt™ pipeline issues alongside your application monitoring.
What you can do
- Automatically track dbt™ run failures in New Relic
- Leverage New Relic’s incident management workflows
- Monitor pipeline health alongside your application monitoring
- Reduce time to resolution for data pipeline issues
Paradime uses the New Relic API to automatically create incidents for Bolt Schedules.
Prerequisites
Before connecting New Relic to Paradime, make sure you have:
- An existing Bolt schedule
- Admin access to New Relic
- Access to New Relic Account ID and API Key
Step 1: Gather your New Relic credentials
- Get Your Account ID:
- Generate API Key:
Important: Store your API key securely. You will need it to configure the Paradime integration.
Step 2: Connect New Relic to Paradime
- In Paradime, go to Settings → Integrations (see connecting integrations), and find New Relic.
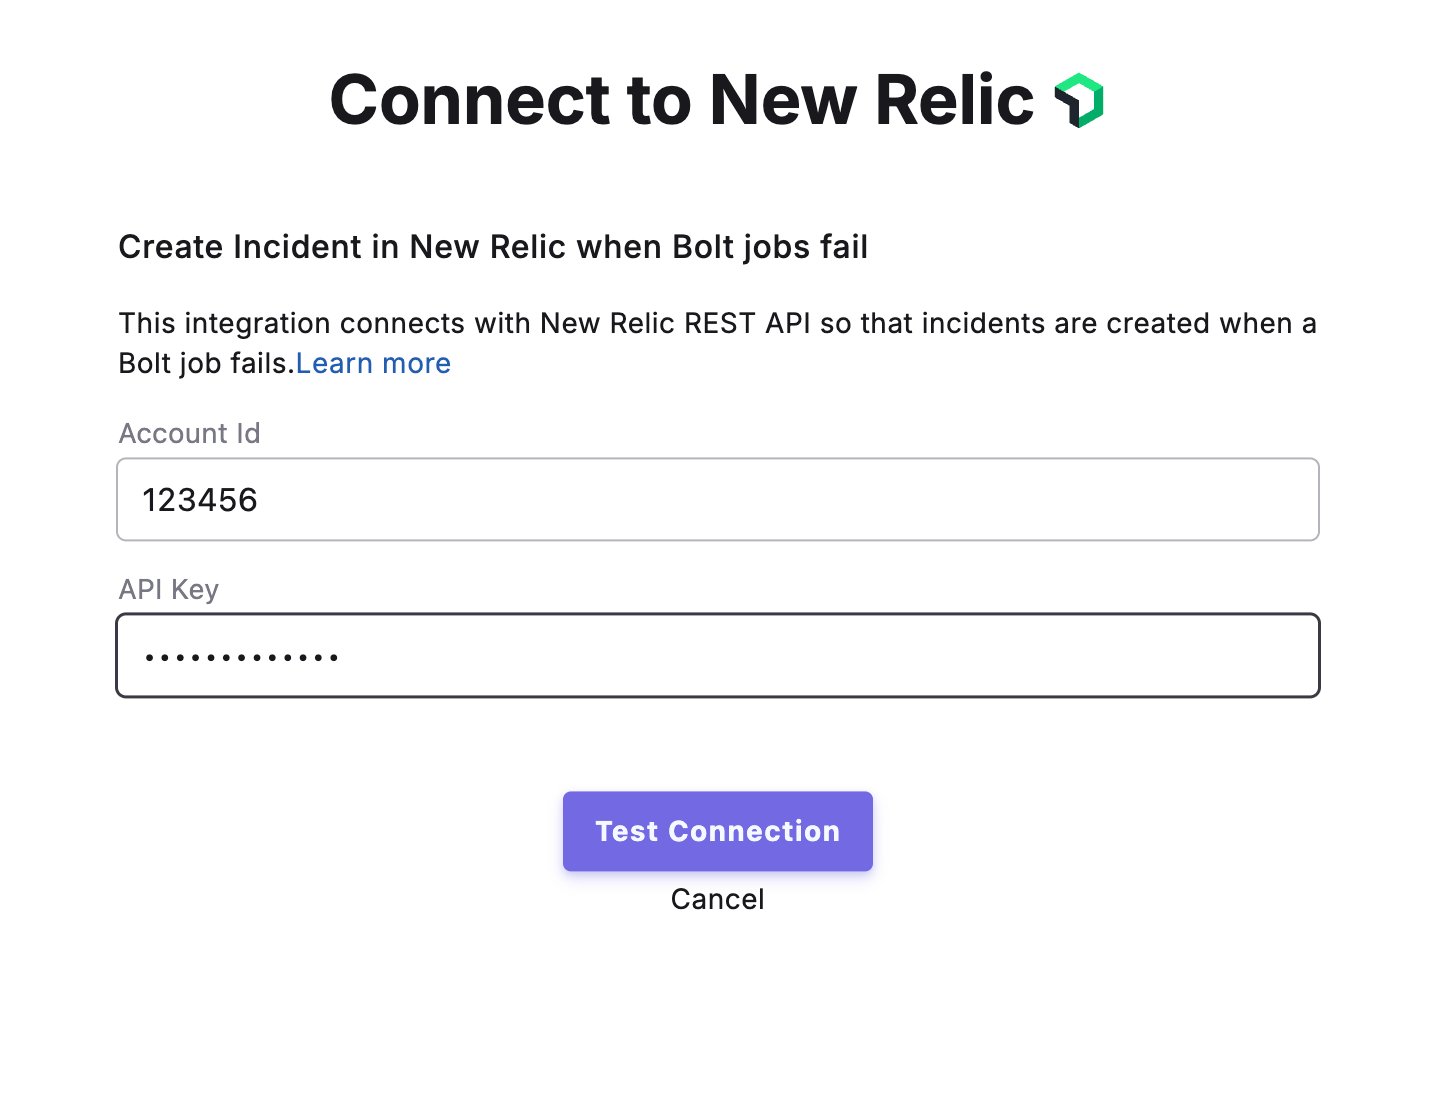
- Enter your New Relic Account ID.
- Paste your New Relic API Key into the field provided.
- Click Create to establish the connection.
Once connected, Paradime will automatically create incidents in New Relic whenever Bolt runs fail.
Step 3: Enable New Relic for your Bolt schedules
After enabling the integration, you can configure which Bolt Schedules should create incidents in New Relic when they fail.
To configure incident creation:
- Navigate to Bolt > Schedules in the Paradime interface.
- Select the schedule you want to monitor.
- Open the Integration Settings for that schedule.
- Enable New Relic Incident Creation to automatically create incidents in New Relic when the schedule fails.
Once enabled, any failures in the configured Bolt Schedules will automatically trigger incident creation in New Relic, allowing your team to respond quickly to data pipeline issues.