

The DinoAI Admin Dashboard is only available to workspace admins.
Accessing the Admin Dashboard
The Admin Dashboard is located in the Paradime Settings section and provides organization-wide visibility into DinoAI usage patterns. Step-by-Step Instructions:- Navigate to Settings in your Paradime workspace
- Click on the “AI Summary” tab to access the dashboard
- Review the analytics across different time frames and users
- Monitor usage patterns to understand team adoption and engagement
AI Usage Overview
Track comprehensive DinoAI usage metrics across all users in your organization with the ability to change the date range. The overview provides insights into how your team interacts with DinoAI’s various capabilities and tools.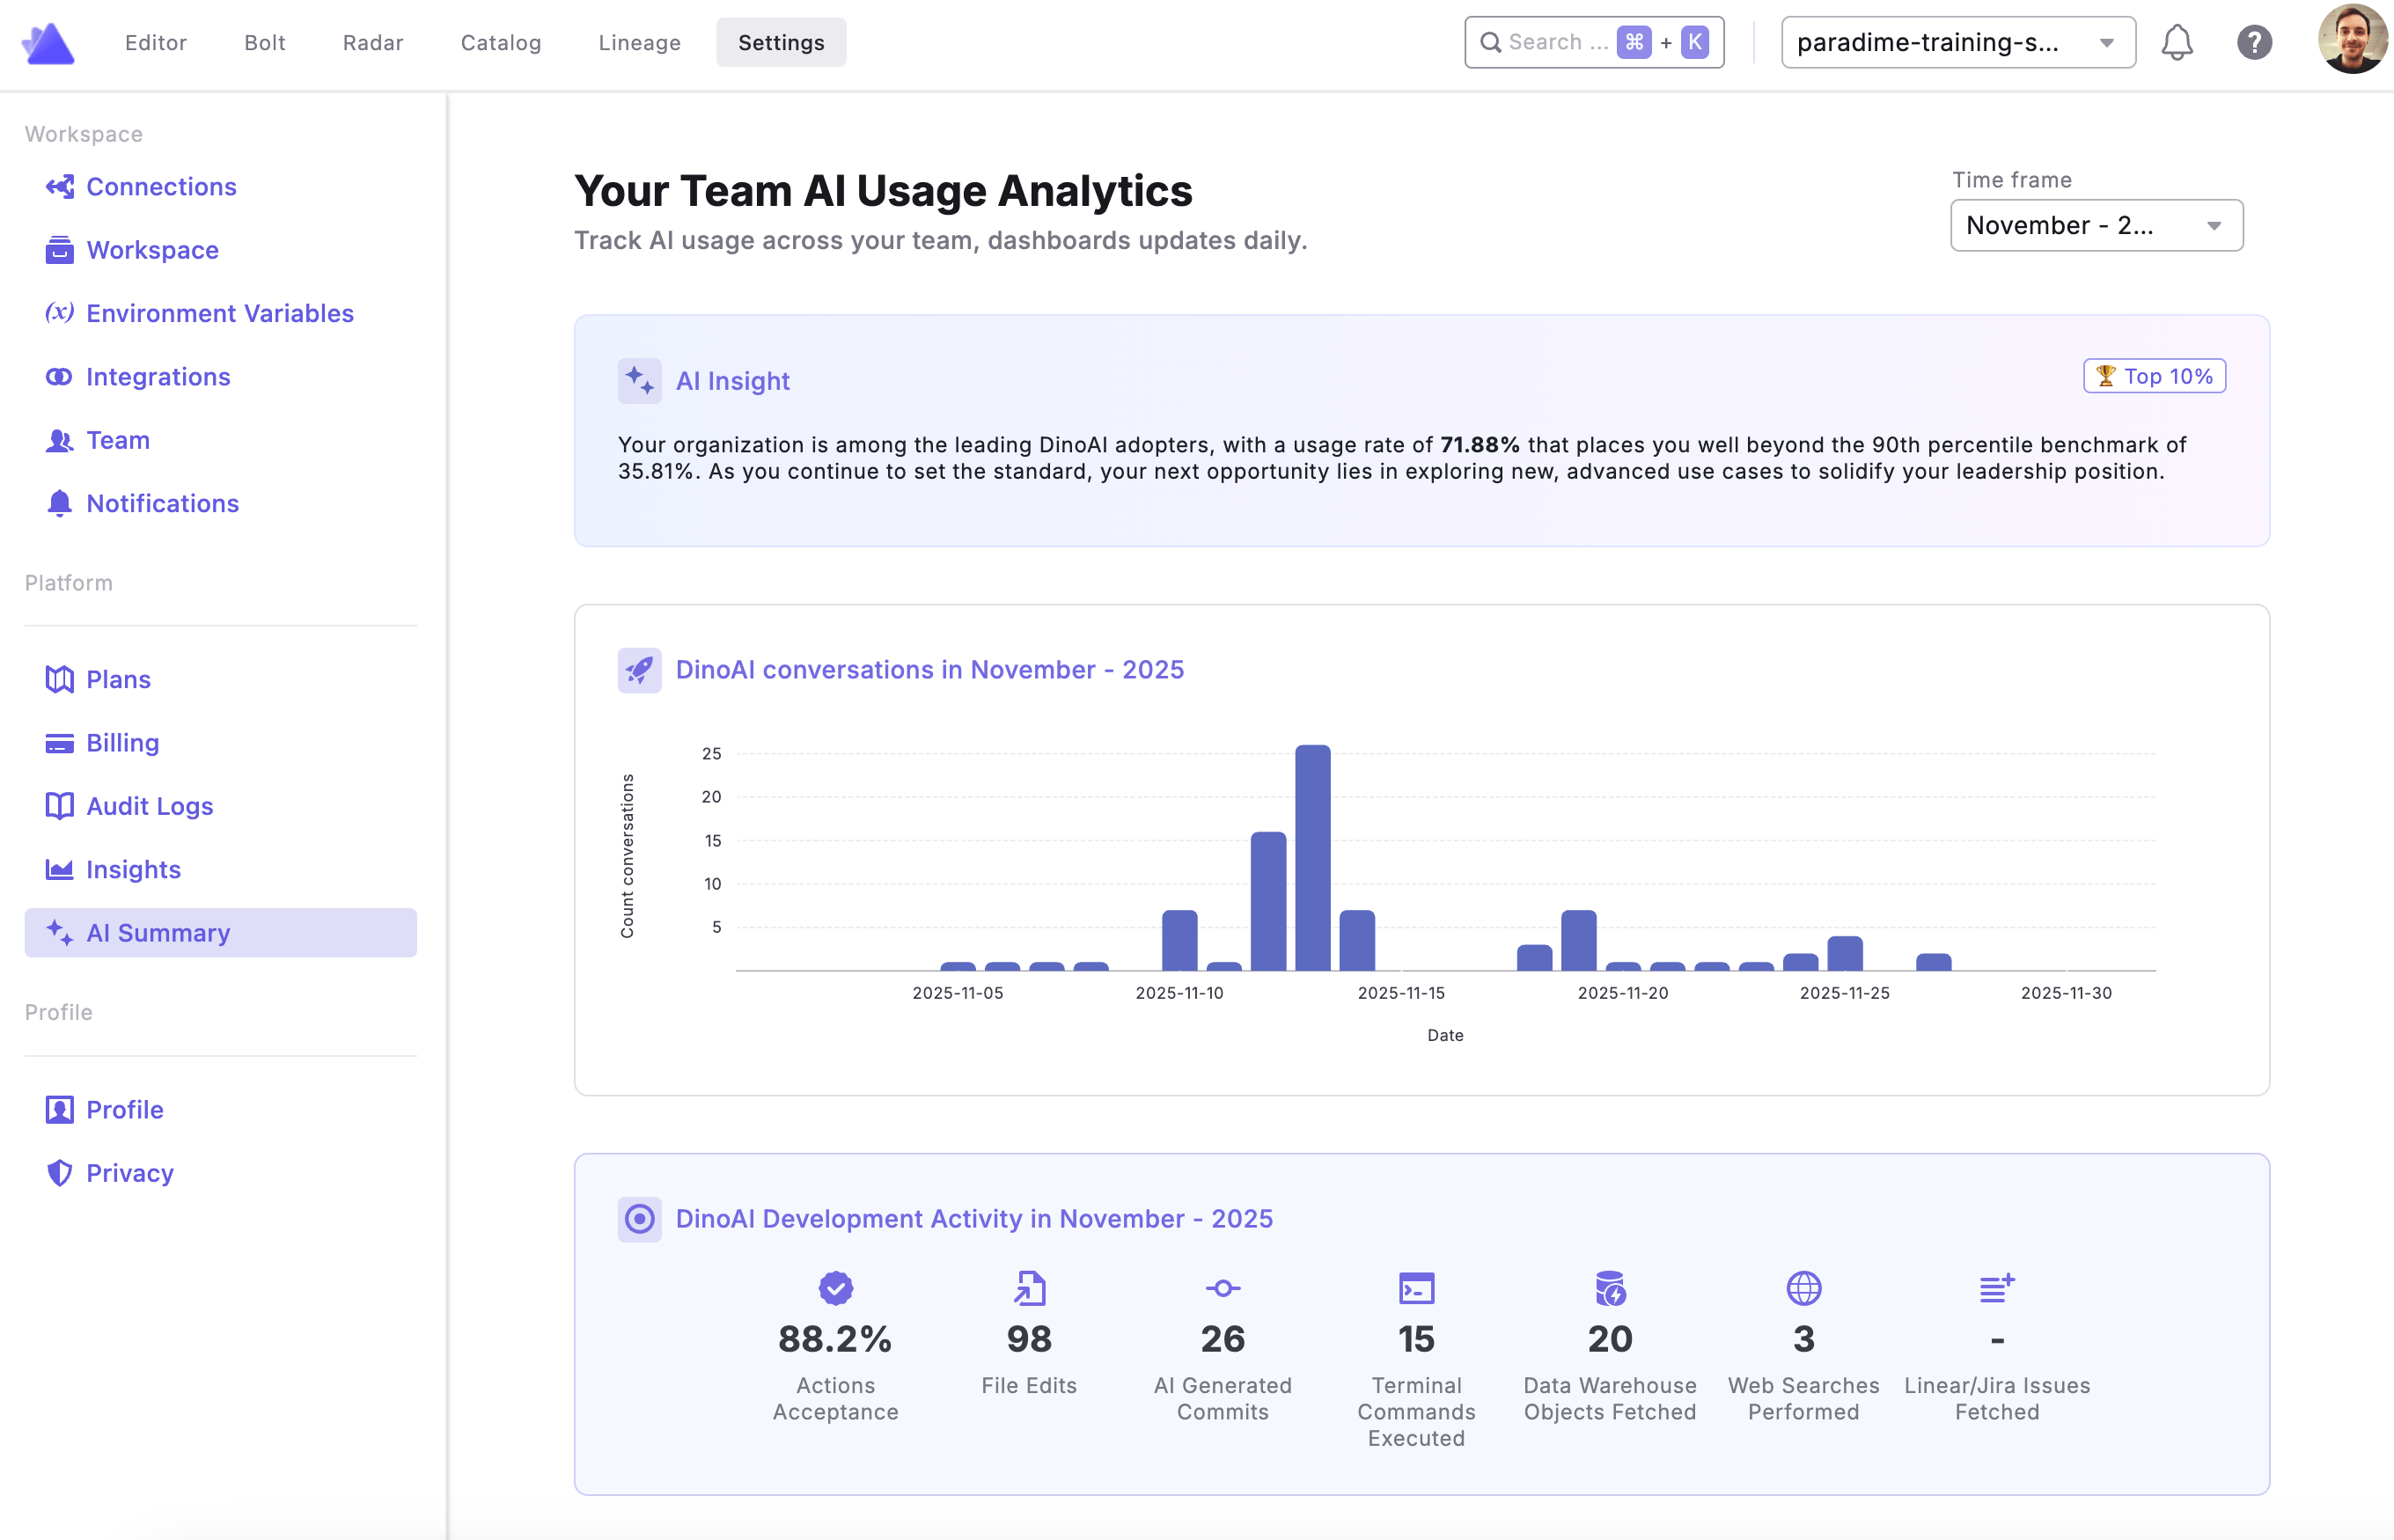
Key Metrics Tracked
The dashboard monitors DinoAI activities including AI conversations, commits generated, tool usage (Perplexity, Jira, Linear, etc.), file operations, and data warehouse interactions.User Engagement Analytics
Monitor individual user engagement with DinoAI to understand adoption patterns across your team.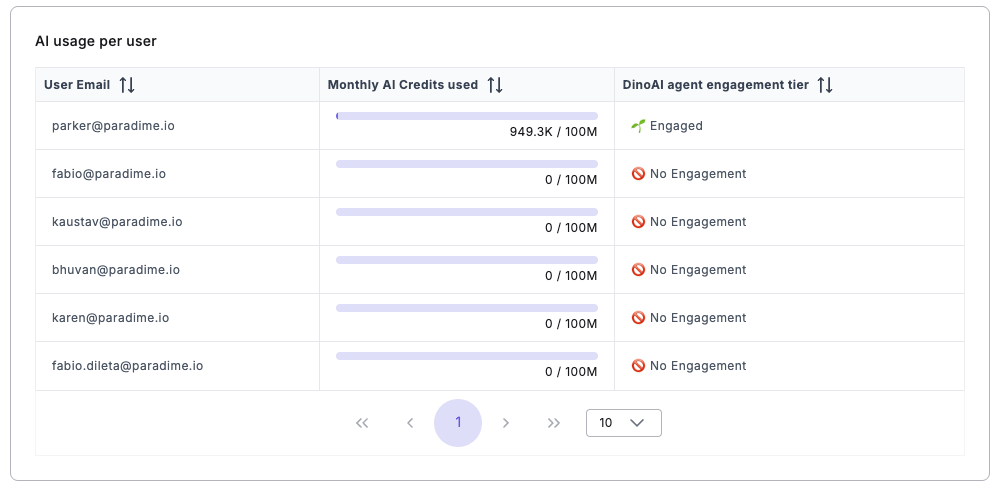
Engagement Levels
- 🌱 Engaged: Users actively utilizing DinoAI features and tools
- 🚫 No Engagement: Users who haven’t interacted with DinoAI in the selected time frame
Key Benefits: Identify team adoption patterns, spot training opportunities, and understand resource usage for capacity planning.