

What the Summary Includes
For each command executed in a Bolt run, DinoAI provides:- Execution overview — a plain-language summary of what the command did
- Warnings and errors — surfaced and explained in context, not just raw stack traces
- Recommendations — actionable suggestions to improve reliability and performance
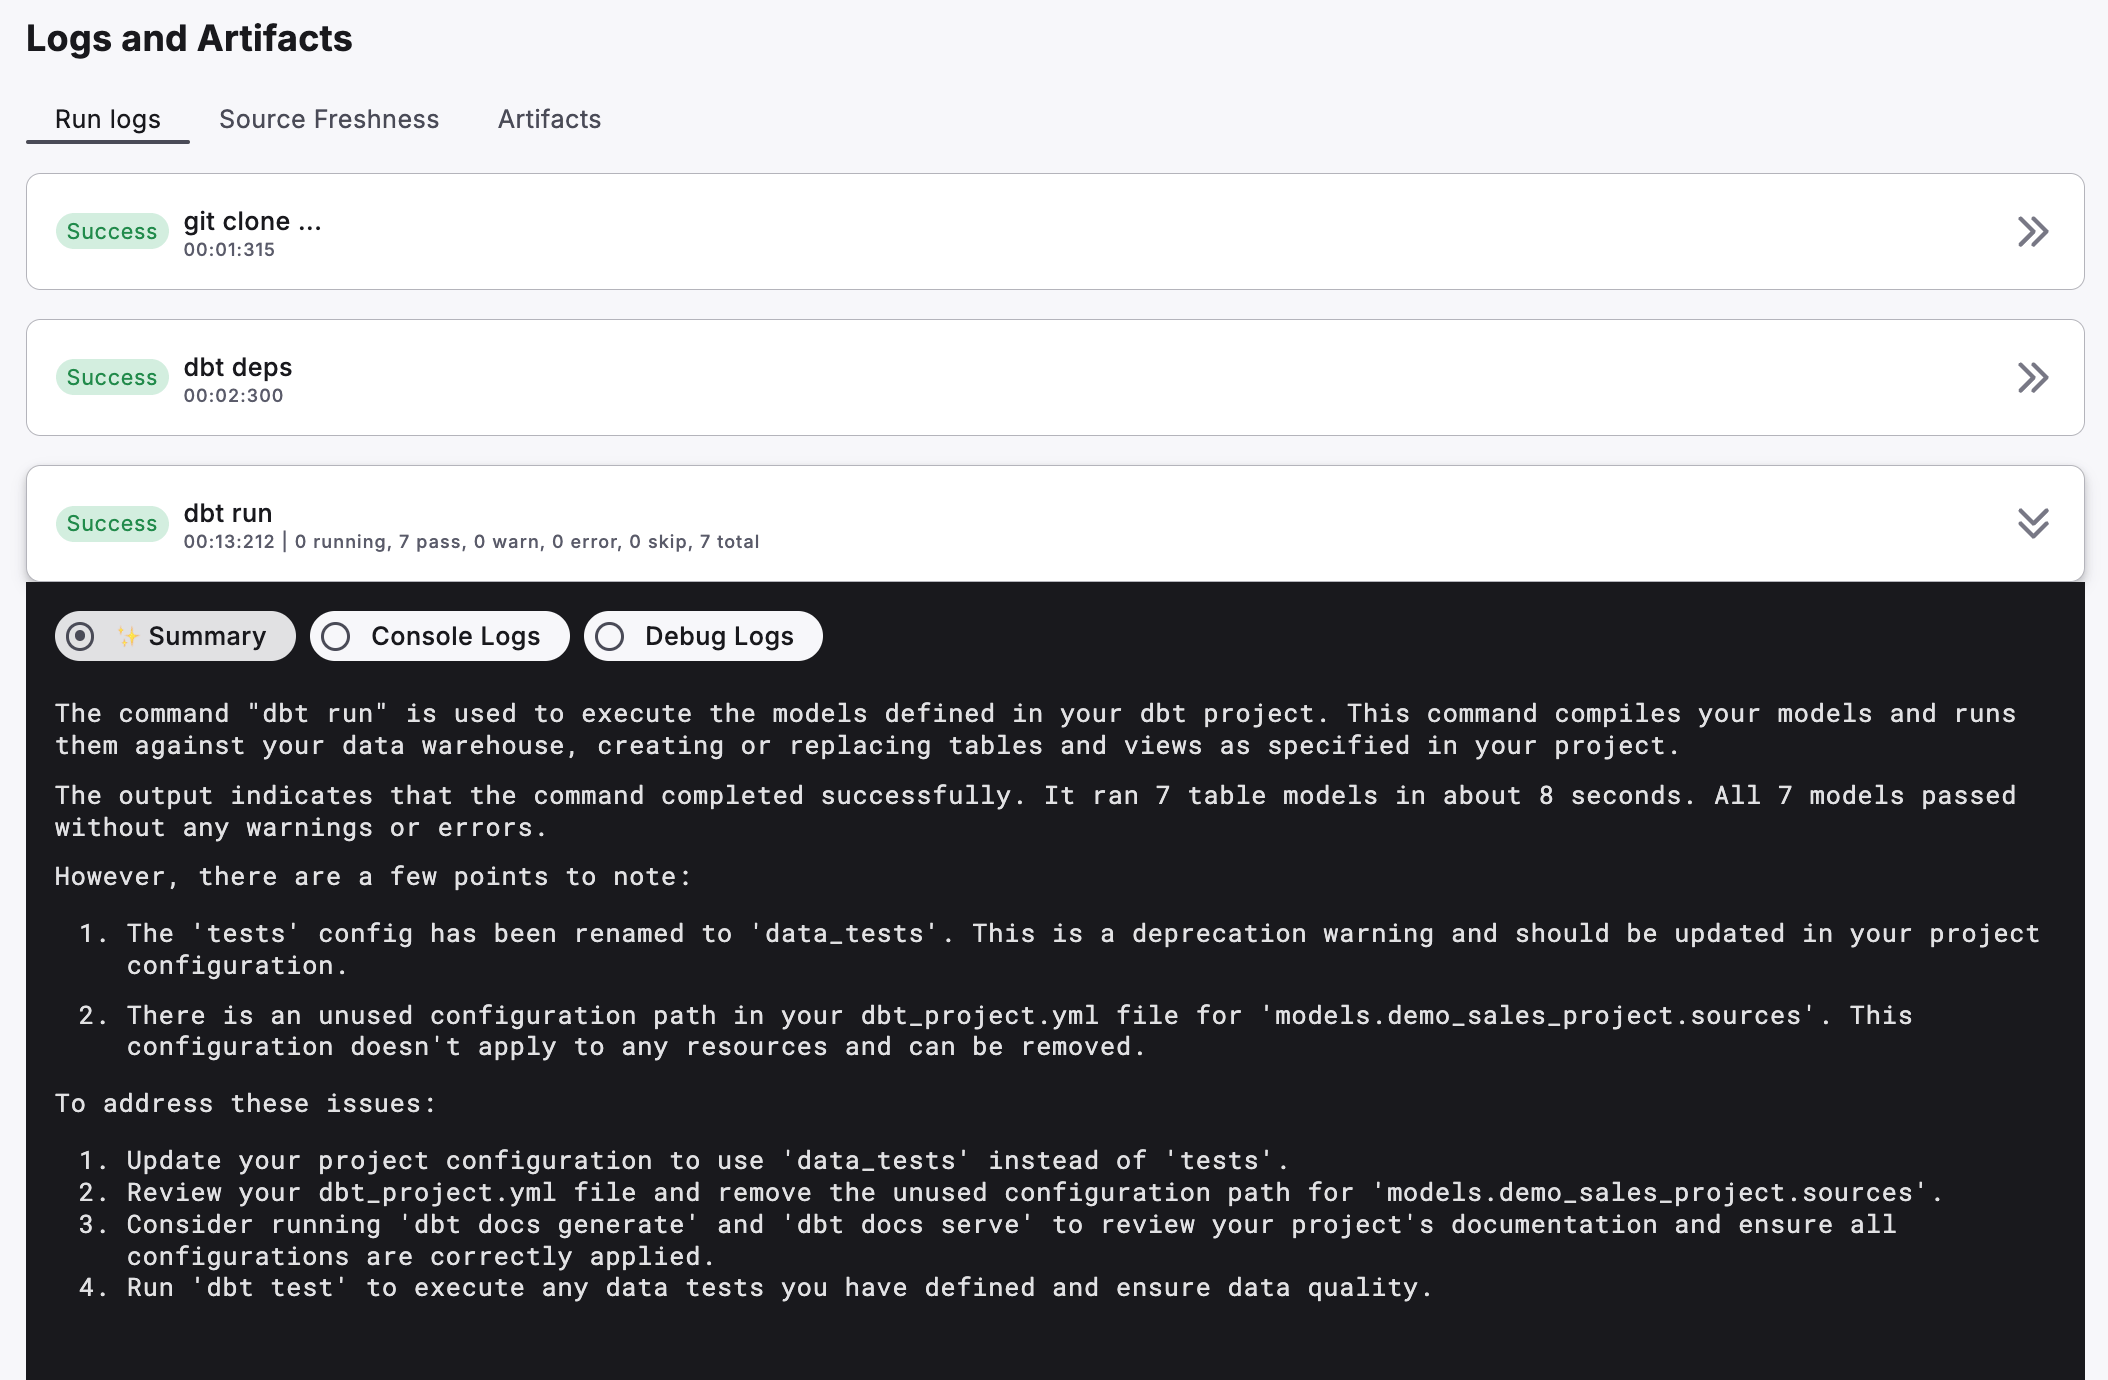
Example: DinoAI Summary
Turbo CI summaries on GitHub
DinoAI summaries also appear on pull requests. When a Turbo CI run fails, Paradime posts the DinoAI Summary as a comment on the pull request — so reviewers can see why CI failed without leaving GitHub.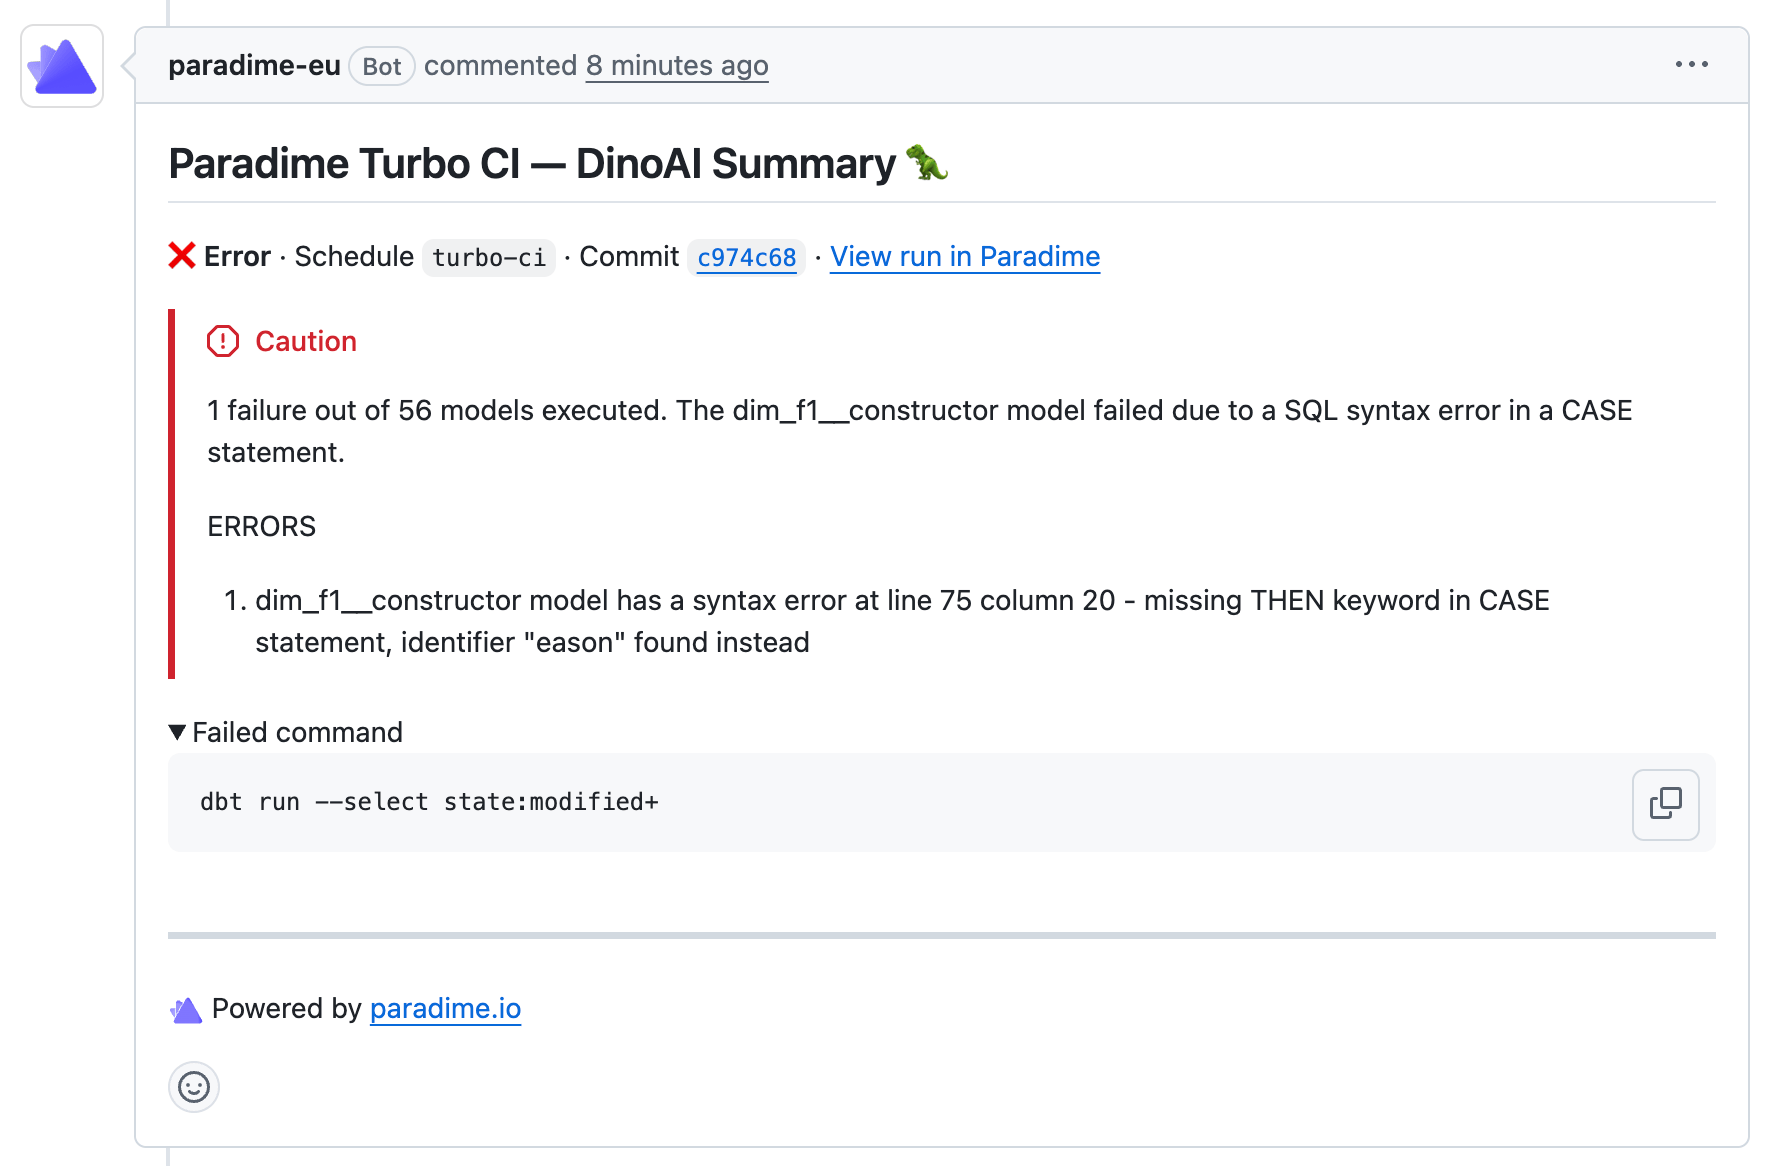
Troubleshooting Pipeline Runs
- Open the Bolt UI and select a schedule
- Scroll down to Run History and click on a specific run
- Scroll down to Logs and Artifacts
- Select a command that has an error or warning (e.g.
dbt run) - Click the Summary tab to see the DinoAI-generated analysis
Tip: The Summary tab is most useful when a command has failed or produced warnings — that’s when DinoAI’s analysis saves the most time.
Next Steps
Once you’ve reviewed the summary, you have two options:- Fix it yourself — use the recommendations to make changes in the IDE
- Let DinoAI fix it — use Fix with DinoAI to trigger a one-click fix directly from the run
Related
- Bolt Schedules — Setting up and managing your pipelines
- Fix with DinoAI — One-click fixes based on run errors
- Self-Healing — Automatically fix and re-run failed pipelines