

What are Class Diagrams?
Mermaid’s class diagrams help you visualize data structures and their relationships in your projects. For analytics engineers, they’re particularly useful for documenting data models, transformation logic, and system architectures.Creating Your First Class Diagram
- Launch DinoAI: From Code IDE, access DinoAI to start creating diagrams.
- Use a Simple Prompt: Tell DinoAI what kind of Class Diagram you want to create. For example:
- Get Your Diagram: DinoAI will generate a complete
.mmdfile with proper Mermaid syntax. - Preview Your Work: Click the eye icon (👁️) to preview your diagram in real-time as you edit.
- Iterate and Refine: Modify the generated
.mmdfile directly, or ask DinoAI to make specific changes.
Example:
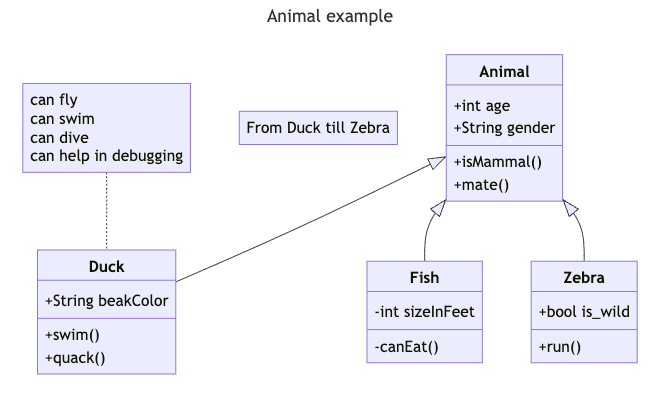
Reusable Class Diagrams prompts for you and your teamYou can create custom, standardized .dinoprompts for Mermaid’s Class Diagrams that ensure consistency across your data team. See step-by-step guide.
Diagram Syntax Guide
Class Structure
A class diagram represents data objects and their relationships. Each class shows:- The class name
- Its attributes (properties)
- Its methods (operations)
Basic Syntax
Access Levels
Show visibility with these symbols:+: Public access-: Private access#: Protected access~: Internal access
Connections
Show relationships between classes: Common relationships:- Parent-child:
<|-- - Contains:
*-- - Uses:
--> - Optional:
o--
Data Team Examples
Data Models
Transformation Pipeline
Best Practices
- Name classes clearly and consistently
- Show only relevant attributes and methods
- Group related classes together
- Add notes for complex relationships
- Keep diagrams focused on one aspect of your system
Additional ResourcesFor more syntax options and advanced features, visit the official Mermaid documentation