

What are Sankey Diagrams?
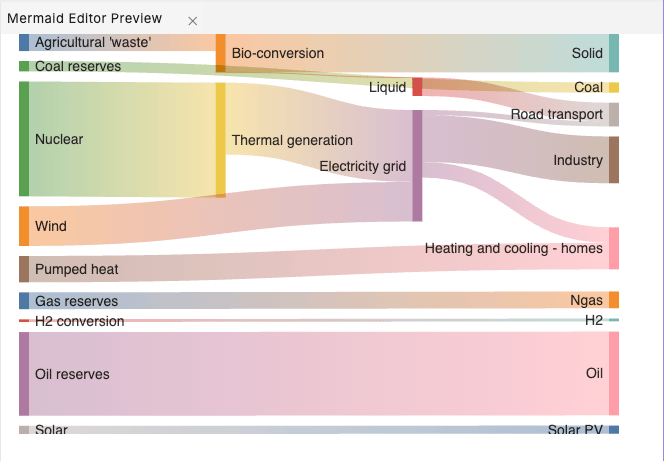
Mermaid’s Sankey diagrams provide a visual representation of flow and relationships between nodes, showing the proportional values in a process. Commonly used to display resource or energy flow, they highlight the relative sizes of inputs, outputs, and connections, making it easy to analyze and optimize processes.Creating Your First Sankey Diagram
- Launch DinoAI: From Code IDE, access DinoAI to start creating diagrams.
- Use a Simple Prompt: Tell DinoAI what kind of Sankey Diagram you want to create. For example:
- Get Your Diagram: DinoAI will generate a complete
.mmdfile with proper Mermaid syntax. - Preview Your Work: Click the eye icon (👁️) to preview your diagram in real-time as you edit.
- Iterate and Refine: Modify the generated
.mmdfile directly, or ask DinoAI to make specific changes.
Example:
Reusable Sankey Diagrams prompts for you and your teamYou can create custom, standardized .dinoprompts for Mermaid’s Sankey Diagrams that ensure consistency across your data team. See step-by-step guide.
Diagram Syntax Guide
Basic Syntax
- Define the diagram using
sankey-beta. - Each row specifies a source, target, and value, separated by commas.
Formatting Rules
- Empty Lines: You can leave blank lines for better readability.
- Commas: Enclose text with commas in double quotes.
- Double Quotes: Escape double quotes by using two double quotes.
Configuration Options
You can customize the diagram’s appearance using configuration settings. Example Configuration- Link Colors: Adjust the link colors.
source: Color matches source node.target: Color matches target node.gradient: Smooth transition between source and target colors.#hexcode: Specify a specific hex color.
- Node Alignment: Change alignment using
justify,center,left, orright.
Data Team Examples
Resource Flow
Energy Distribution
Best Practices
- Clearly define nodes and values.
- Use intuitive labels for source and target nodes.
- Adjust link colors and node alignments for clarity.
- Keep the number of nodes manageable for readability.
- Regularly update diagrams to reflect current data flows.
Additional ResourcesFor more syntax options and advanced features, visit the official Mermaid documentation.