

What are Gantt Diagrams?
Gantt diagrams help you visualize project timelines and track task dependencies. For data teams, they’re valuable for planning data pipeline releases, scheduling model updates, and managing project milestones. Each task appears as a bar extending from its start date to its end date.Creating Your First Gantt Diagram
- Launch DinoAI: From Code IDE, access DinoAI to start creating diagrams.
- Use a Simple Prompt: Tell DinoAI what kind of Gantt Diagram you want to create. For example:
- Get Your Diagram: DinoAI will generate a complete
.mmdfile with proper Mermaid syntax. - Preview Your Work: Click the eye icon (👁️) to preview your diagram in real-time as you edit.
- Iterate and Refine: Modify the generated
.mmdfile directly, or ask DinoAI to make specific changes.
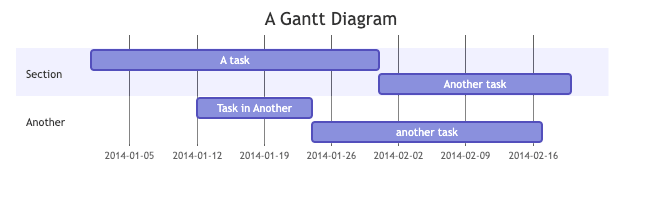
Example:
Reusable Gantt Diagram prompts for you and your teamYou can create custom, standardized .dinoprompts for Mermaid’s Gantt that ensure consistency across your data team. See step-by-step guide.
Diagram Syntax Guide
Basic Structure
Task Types
- Regular task: No special prefix
- Critical task: Add
crittag - Active task: Add
activetag - Completed task: Add
donetag - Milestone: Add
milestonetag
Task Dependencies
after TaskID: Start after another task- Fixed dates: Specify start and duration
- Duration units: d (days), h (hours), m (minutes)
Data Team Examples
Data Pipeline Release
Model Training Schedule
Best Practices
- Use clear section names to group related tasks
- Include key milestones
- Mark critical path tasks
- Consider weekends and holidays with
excludes - Add dependencies between tasks
- Keep timelines realistic
Additional ResourcesFor more syntax options and advanced features, visit the official Mermaid documentation