

What Are Timeline Diagrams?
Marmaid’s Timeline diagrams provide a graphical representation of events or periods over time. They help illustrate the sequence and relationship between events, making them a powerful tool for visualizing histories, schedules, and project timelines.Creating Your First Timeline Diagram
- Launch DinoAI: From Code IDE, access DinoAI to start creating diagrams.
- Use a Simple Prompt: Tell DinoAI what kind of Timeline Diagram you want to create. For example:
- Get Your Diagram: DinoAI will generate a complete
.mmdfile with proper Mermaid syntax. - Preview Your Work: Click the eye icon (👁️) to preview your diagram in real-time as you edit.
- Iterate and Refine: Modify the generated
.mmdfile directly, or ask DinoAI to make specific changes.
Example:
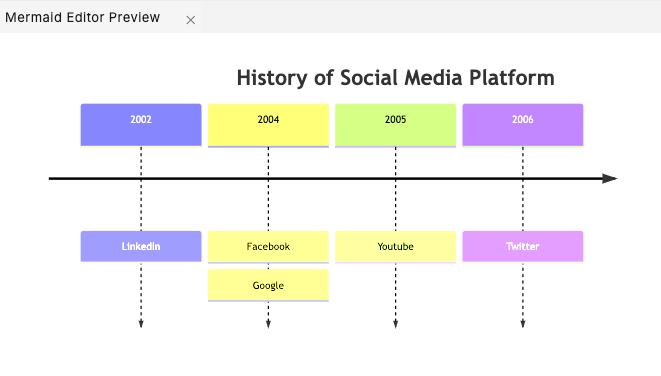
Reusable Timeline Diagram prompts for you and your teamYou can create custom, standardized .dinoprompts for Mermaid’s Timeline Diagram that ensure consistency across your data team. See step-by-step guide.
Syntax and Components
The syntax for creating Timeline diagrams in Mermaid is straightforward:- Start with the
timelinekeyword. - Optionally add a title with the
titlekeyword. - Define time periods followed by their events in the format:
Examples
Basic Timeline
Grouping Time Periods
Styling Options
Using Themes
Mermaid offers several themes such asbase, forest, dark, neutral, and default. To apply a theme, use the %%{init} directive:
Custom Colors
You can customize colors usingcScale and cScaleLabel variables:
Best Practices
- Keep it Chronological: Ensure events are listed in proper order.
- Use Sections for Clarity: Group related events into sections for better organization.
- Customize Colors: Use distinct colors for sections to enhance readability.
Advanced Features
- Line Breaks: Use
<br>to add line breaks in event text. - Disable Multi-Color: Use the
disableMulticoloroption for uniform colors.
Additional ResourcesFor more advanced configurations and examples, refer to the Mermaid documentation.